
Page 53 - 2021_06-Haematologica-web
P. 53
Roles of ALDH in T-ALL
Online Supplementary Figure S7D). These results indicate that although overexpression of ALDH1A2 alone does not have oncogenic capability, it can promote T-cell leukemo- genesis induced by a driver oncogene.
Discussion
ALDH1A2 is one of the first reported downstream targets of TAL1 in T-ALL cells. Using the subtractive PCR method,
AB
Ono et al. isolated ALDH1A2 in T-ALL cell lines that co- expressed TAL1, LMO and GATA3.12 Our ChIP-sequencing and RNA-sequencing experiments also demonstrated that ALDH1A2 is directly activated by the TAL1 complex via an intronic regulatory element in T-ALL cells. The short iso- form of ALDH1A2 is specifically expressed in T-ALL cells. Importantly, ALDH1A2 expression is highly specific to T- ALL cells, mostly to the TAL1-positive subgroup. Thus, using a novel approach, our studies reconfirmed that ALDH1A2 is a signature gene of TAL1-positive T-ALL.
CD
E
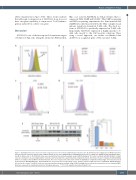
Figure 6. ALDH1A2 reduces the levels of reactive oxygen species in T-cell acute lymphoblastic leukemia cells. (A, B) Total reactive oxygen species (ROS) levels were measured by flow cytometry analysis using CellROX staining at 72 h after shRNA-mediated ALDH1A2 depletion (A) or at 48 h after sgRNA-mediated ALDH1A2 deple- tion (B) in Jurkat cells. (C, D) Total ROS levels were measured by flow cytometry analysis using CellROX staining at 72 h after treatment with WIN 18,446 of Jurkat cells (C) or primary T-cell acute lymphoblastic leukemia cells harvested from a patient-derived xenograft model (D). (E) Jurkat cells were transduced with ALDH1A2 cDNA or an empty vector by MSCV retrovirus infection. The level of expression of the short isoform of ALDH1A2 in established Jurkat single clones was measured by western blot. MIG-ALDH1A2 #10, #12 and #18 were selected as the overexpressing clones, and they expressed different levels of ALDH1A2. MIG-EV #14 was selected as the control. Total ROS levels were measured by flow cytometry analysis using CellROX staining and are reported as mean fluorescence intensity (MFI). Error bars represent the standard deviation for biological replicates. ***P<0.001 using the two-tailed Student t test.
haematologica | 2021; 106(6)
1555
