
Page 51 - 2021_06-Haematologica-web
P. 51
Roles of ALDH in T-ALL
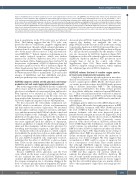
Figure 4. ALDH1A2 affects metabolic pathways in T-cell acute lymphoblastic leukemia cells. (A) sgRNA #1 was introduced into Jurkat cells by doxycycline (Dox) treatment for 72 h in duplicate (dup 1 and dup 2). Differentially expressed genes were selected based on the following criteria: P<0.05, log2 fold change < -0.4 or >0.4, and mean transcript per million (TPM) value of the control >250. Heatmap image showing relative mRNA expression levels of the differentially expressed genes in the control (Dox-) and ALDH1A2-depleted cells (Dox+). The genes involved in the glycolysis pathway are highlighted. (B) A scheme showing the metabolic enzymes involved in the glycolysis pathway. The genes significantly downregulated by ALDH1A2 depletion are highlighted. (C) ALDH1A2 expression was depleted in Jurkat cells by Dox-inducible sgRNA-mediated transcriptional repression in biological duplicates. Downregulation of ALDH1A2 mRNA expression was confirmed by quanti- tative reverse transcription polymerase chain reaction. ***P<0.001 using the two-tailed Student t test. Relative amounts of the metabolites in the glycolysis pathway and the tricarboxylic acid cycle were measured by capillary electrophoresis time-of-flight mass spectrometry in the control cells (blue) and the ALDH1A2-depleted cell samples (red). Error bars represent the standard deviation for biological replicates.
from 2-oxoglutarate in the TCA cycle were not affected (blue). This finding suggests that the TCA cycle, sup- pressed by the loss of ALDH1A2, might be supplemented by glutaminolysis through which external glutamine is converted into 2-oxoglutarate. Glutamine has been report- ed to be the major carbon source for T-ALL cells with acti- vated NOTCH1.33,34 Indeed, depletion of glutamine in cul- ture media induced apoptosis, which was further increased by ALDH1A2 depletion after 24 h of doxycy- cline treatment (Online Supplementary Figure S4E and F). In the presence of glutamine, ALDH1A2 depletion alone did not induce apoptosis before 48 h of induction (Figure 3B, Online Supplementary Figure S4E and F). Thus, these results suggest that external glutamine might be used to replenish downstream metabolites to maintain the TCA cycle in the absence of ALDH1A2, and that ALDH1A2 and gluta- minolysis pathways may compensate each other.
ALDH1A2 supports cellular aerobic glycolysis and energy production in T-cell acute lymphoblastic leukemia cells
Our results suggest that ALDH1A2 directly or indirectly affects major metabolic pathways. In particular, aerobic glycolysis is a hallmark of cancer metabolism and has also been reported to be activated in T-ALL cells.35 Because metabolic profiling can represent only the static state, we then analyzed the dynamic state of these pathways after ALDH1A2 depletion using the Seahorse XF24 platform.
We first measured the extracellular acidification rate (ECAR), which is an indicator of lactic acid fermentation and thus reflects the activity of glycolysis. We incubated the cells under conditions of glucose starvation, added glu- cose, and then measured the ECAR in both the control and ALDH1A2-depleted cells. Strikingly, ALDH1A2 depletion inhibited aerobic glycolysis, as shown by the reduction of the baseline ECAR (“glycolysis” in Figure 5A). This trend was more significant upon the addition of oligomycin, which is an inhibitor of complex V in the electron transport chain and thus maximizes cellular aerobic glycolysis by disturbing mitochondrial respiration (“glycolytic capaci- ty”). Treatment with 2-deoxy-D-glucose, which competi- tively inhibits the production of glucose-6-phosphate from glucose, completely abolished these activities in both con- trol and ALDH1A2-depleted cells (“glycolytic reserve”), indicating that the effect of ALDH1A2 is glucose-depen- dent. These results demonstrated that the expression of ALDH1A2 promotes cellular glycolysis and contributes to the maintenance of metabolome plasticity by increasing cellular glycolytic capacity in T-ALL cells.
Because ALDH1A2 affects glycolysis and the TCA cycle, which are the major sources of energy production, we also analyzed the effect of ALDH1A2 depletion on oxidative phosphorylation in mitochondria. We measured the oxygen consumption rate to determine changes in the level of oxidative phosphorylation-dependent ATP gener- ation. As expected, the basal respiration level was
decreased after ALDH1A2 depletion (Figure 5B). To further support this finding, we analyzed the ratio of NAD+/NADH and the amount of ATP in the same setting. Consistently, depletion of ALDH1A2 increased the ratio of NAD+/NADH, thus preventing NADH production (Figure 5C). ATP production normalized by the number of cells was also decreased by ALDH1A2 depletion (Figure 5D). Furthermore, in the cells cultured in glucose-free medium, ALDH1A2 depletion inhibited ATP production more strongly than it did in the control cells (Online Supplementary Figure S5A). These results indicate that ALDH1A2 supports energy production, which explains the cell phenotype after ALDH1A2 depletion.
ALDH1A2 reduces the level of reactive oxygen species in T-cell acute lymphoblastic leukemia cells
A high level of oxidative phosphorylation in mitochon- dria has been known to produce oxidative stress such as reactive oxygen species (ROS). On the other hand, previ- ous studies provided evidence that ALDH family proteins help to alleviate intracellular ROS.36-38 The underlying mechanism is attributable to the ability of these proteins to clear cellular aldehydes, which are known ROS induc- ers.39-41 Thus, we next measured the total level of intracel- lular ROS after depletion of ALDH1A2 in Jurkat cells using three different settings (sgRNA, shRNA and a small-mole- cule inhibitor).
Strikingly,geneticinhibitionwithshRNA(Figure6A)or sgRNA (Figure 6B) resulted in significant increases in ROS levels. Similarly, treatment with WIN 18,446 increased the level of ROS in Jurkat cells (Figure 6C) as well as in primary leukemia cells that were harvested from a patient-derived xenograft mouse model (Figure 6D), both of which expressed only the short isoform of ALDH1A2 (Online Supplementary Figure S6A). Conversely, overex- pression of the short isoform of ALDH1A2 reduced the level of ROS (Figure 6E). Furthermore, treatment with N- acetyl cysteine, an antioxidant, was able to reduce the ROS level after ALDH1A2 depletion in Jurkat cells (Online Supplementary Figure S6B). Importantly, in the setting of sgRNA knockout, ROS was increased at 48 h after doxy- cycline treatment (Figure 6B) before the induction of apoptosis was observed (Figure 3B). This suggests that accumulation of ROS could be a cause of apoptosis but not a consequence of cell death. These results indicate that although ALDH1A2 supports energy production, which potentially increases oxidative stress, it more pre- dominantly plays a role protecting against the production of ROS and thus supports cell survival, which also explains the phenotype after ALDH1A2 depletion. Of note, N-acetyl cysteine treatment did not restore cell via- bility after ALDH1A2 depletion (data not shown), suggest- ing that the cell viability phenotype was mainly attribut- able to the maintenance of glycolysis and energy produc- tion.
haematologica | 2021; 106(6)
1553
