
Page 173 - 2021_06-Haematologica-web
P. 173
Mobilization regulated by PPARd
A
B
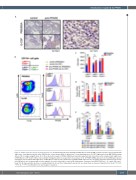
Figure 3. PPARd expression in bone marrow myeloid cells. (A) Immunohistochemical staining for PPARd in bone marrow (BM) sections from mice after treatment with eight doses of phosphate-buffered saline (PBS)/bovine serum albumin (BSA) or granulocyte colony-stimulating factor (G-CSF). Right panel shows BM PPARδ staining after G-CSF at a higher magnification. (B, C) Flow cytometric analysis of PPARd in BM major myeloid populations (dot plot profiles) after treatment with eight doses of PBS/BSA or G-CSF shown in (B) as representative histograms and in (C) as geometric mean values (n=3). (D) PPARd mRNA expression in sorted BM major myeloid populations after treatment with eight doses of PBS/BSA or G-CSF (n=3-4). (E) Alteration of PPARd mRNA expression in sorted major myeloid populations from steady- state BM after in vitro treatment with selective agonists for each b-adrenergic receptor (b-AR) (dobutamine, clenbuterol, and BRL37344 for b1-, b2-, and b3-AR, respec- tively; n=3-8). Representative pictures or combined data from at least three independent experiments are shown. Data are mean ± standard error of mean. *P<0.05, **P<0.01, ***P<0.001 (Student t test and analysis of variance).
C
D
E
haematologica | 2021; 106(6)
1675
