
Page 63 - 2021_05-Haematologica-web
P. 63
Pro-leukemic effects of P2X7
Overexpression of P2X7 promotes proliferation of MLL- AF9-induced acute myeloid leukemia cells
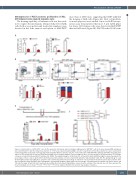
The homing capability of leukemia cells was first stud- ied to explore the mechanism. Unexpectedly, fewer AML cells (both as a proportion and in absolute numbers) were detected in the bone marrow and spleen of MA9-P2X7
A
mice than of MA9 mice, suggesting that P2X7 inhibited the homing of AML cells (Figure 4A). Next, cell prolifera- tion and apoptosis were studied. An in vivo BrdU incorpo- ration assay demonstrated that more S and G2/M phase but fewer G0/G1 phase cells were detected in MA9-P2X7 than in MA9 mice (Figure 4B). Ki67/Hoechst 33342 stain-
BCD
E
F
Figure 4. Characteristics of MA9-P2X7 cells. (A) The proportion (left panel) and total number (right panel) of GFP+BFP+ cells in the bone marrow (BM) and spleen were determined 16 h after the intravenous injection of 9×10⁶ acute myeloid leukemia (AML) cells into recipient mice (n=4). (B) Leukemic mice were sacrificed 16 h after intraperitoneal injection of 200 mg of bromodeoxyuridine (BrdU). Leukemia cells were sorted and stained with BrdU-APC antibody and 7AAD. The gating strat- egy for G0/G1 (bottom left), S (top) and G2/M (bottom right) cells is shown (top panel). The percentages of these cells are plotted (n=3) (bottom panel). (C) Leukemia cells were sorted and stained with Ki67 and Hoechst 33342. The gating strategy for G0 (bottom left), G1 (top left), and S/G2/M (top right) is shown (top panel). The percentages of these cells are plotted (n=3) (bottom panel). (D) Leukemia cells were stained with annexin V and propidium iodide (PI). The gating strategy for early (bottom right) and late (top right) phase apoptotic cells is shown (top panel). The percentage of annexin V+ cells is plotted (n=3) (bottom panel). (E, F) Leukemic mice were treated twice with cytarabine (Ara-C) following the experimental design (E, upper panel). The percentages of peripheral blood leukemia cells before (days 6 and 11) and after (days 14 and 19) Ara-C treatments are plotted (E, bottom panel). Kaplan-Meier curves show the survival of the leukemic mice (F). Bars represent the mean ± standard error of mean. *P<0.05; **P<0.01; ***P<0.001; unpaired Student t test and one-way analysis of variance.
haematologica | 2021; 106(5)
1283
