
Page 61 - 2021_05-Haematologica-web
P. 61
Pro-leukemic effects of P2X7
(Online Supplementary Figure S1A and B). Furthermore, analysis of GSE13204 revealed that P2X7 expression was higher in t(11q23) AML than in t(11q23) B-cell acute lym- phoblastic leukemia (Figure 1F). An overview from BloodSpot confirmed that P2X7 was highly expressed in MLL-rearranged AML (Online Supplementary Figure S1C). These findings suggest that high levels of P2X7 expression correlate with worse prognosis in AML and that P2X7 is highly expressed in MLL-rearranged AML.
Overexpression of P2X7 promotes the progression of MLL-rearranged acute myeloid leukemia
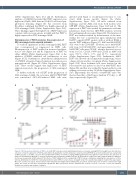
To study its significance in MLL-rearranged AML, P2X7 was overexpressed or suppressed in THP1 cells. Overexpression of P2X7 resulted in increased prolifera- tion in vitro (Figure 2A and B). Suppression of P2X7 by either shRNA (Online Supplementary Figure S2A) or the inhibitor A740003 inhibited cell proliferation in vitro (Figure 2C-E). Furthermore, intratumoral administration of A740003 attenuated tumor formation in a nude mouse xenograft model (Figure 2F, Online Supplementary Figure S2B). These results suggest that high levels of P2X7 expression promote the progression of MLL-rearranged AML.
To further study the role of P2X7 in the progression of MLL-rearranged AML, the retrovirus pMSCV-P2X7-BFP was constructed. MLL-AF9-induced AML cells were
infected with blank or recombinant retrovirus to con- struct AML mouse models (Figure 3A, Online Supplementary Figure S3A). All mice suffered from leukemia, and the AML cells from both models were GFP+BFP+ (Online Supplementary Figure S3B and C). The expression of P2X7 was verified by quantitative real-time polymerase chain reaction (qRT-PCR) analysis, western blot and immunofluorescence (Figure 3B). The function of P2X7 was further verified by measurement of the intra- cellular free Ca2+ concentration upon stimulation with BzATP, a specific P2X7 agonist, with or without KN62, a specific P2X7 inhibitor (Figure 3C). MA9 and MA9-P2X7 cells were both CD3–B220–. However, most MA9-P2X7 cells were Gr1+CD11b+F4/80+, and approximately 2% of MA9-P2X7 cells were CD115+, whereas the rates of posi- tivity for Gr1, CD11b, F4/80 and CD115 in MA9 cells were 39.3%, 72.2%, 17% and 13.7%, respectively (Online Supplementary Figure S3D). Furthermore, MA9- P2X7 cells showed a more immature morphology, such as a larger cell size and less cytoplasm (Online Supplementary Figure S3E). More leukemia cells were detected in the bone marrow and spleen on day 10 in MA9-P2X7 mice (Figure 3E), and this was verified by hematoxylin & eosin staining of sections on day 12 (Online Supplementary Figure S3F). Importantly, the survival of MA9-P2X7 mice was shorter than that of MA9 mice (median 17.5 days vs. 25 days, respectively) (Figure 3D).
ABCD
EF
Figure 2. P2X7 promotes proliferation of THP1 cells. (A, B) THP1 cells were infected with blank retrovirus or retrovirus carrying P2X7. Forty-eight hours after infection, cells were sorted, the expression of P2X7 was determined by quantitative real-time polymerase chain reaction (qRT-PCR) (A), and cell proliferation was evaluated by an MTS assay (B). (C, D) THP1 cells were infected with blank lentivirus or lentivirus carrying shRNA against P2X7. Forty-eight hours after infection, the expression of P2X7 was determined by qRT-PCR (C), and cell proliferation was evaluated by an MTS assay (D). (E) Proliferation of THP1 cells with or without addition of A740003 in vitro was measured by an MTS assay. (F) The effects of P2X7 inhibition on the oncogenicity of THP1 cells were studied by comparing the consequences of intra- tumoral administration of A740003 or phosphate-buffered saline (PBS) in a nude mouse xenograft model. The experimental design is shown in the upper panel. Mice were sacrificed on day 23. Tumor volumes (lower left panel) and weights (lower middle panel) are plotted, and the typical size of tumors is shown (lower right panel). The results are from three independent experiments. Bars represent the mean ± standard error of mean. *P<0.05; **P<0.01; ***P<0.001; unpaired Student t test and one-way analysis of variance.
haematologica | 2021; 106(5)
1281
