
Page 60 - 2021_05-Haematologica-web
P. 60
W. Feng et al.
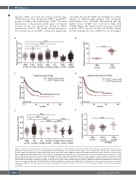
nificance, AML cases from The Cancer Genome Atlas (TCGA) datasets were divided into P2X7high and P2X7low groups according to the median value of P2X7. The main characteristics of the patients and the types of treatment received in the two groups are shown in Online Supplementary Table S3. The overall survival and disease- free survival rates in the P2X7high group were significantly
lower than those in the P2X7low group (Figure 1C and D). Analysis of different AML subtypes with cytogenetic abnormalities from GSE13204 demonstrated that the highest levels of P2X7 were observed in AML with t(11q23) (Figure 1E). Similar results were also obtained from the TCGA datasets (n=144) and GSE6891 dataset (n=355), although the level of P2X7 was not the highest
AB
CD
EF
Figure 1. Expression of P2X7 in patients with hematopoietic malignancies. (A) The relative expression of P2X7 (from microarray experiments) in T-cell acute lym- phoblastic leukemia (T-ALL), B-cell acute lymphoblastic leukemia (B-ALL), acute myeloid leukemia (AML), chronic lymphocytic leukemia (CLL), chronic myeloid leukemia (CML), myelodysplastic syndrome (MDS) and normal control bone marrow (nBM) was obtained from GSE13204. (B) The relative expression of P2X7 in newly diagnosed AML and nBM samples from the Blood Diseases Hospital was determined by assessed by quantitative real-time polymerase chain reaction. (C, D) Using data on AML patients from The Cancer Genome Atlas datasets (https://tcga-data.nci.nih.gov/tcga), the overall survival (C) and disease-free survival (D) of AML patients, divided into P2X7high and P2X7low groups according to the median value of P2X7, were compared by Kaplan-Meier analysis. (E) The relative expression of P2X7 in AML patients with normal karyotype (NK), complex karyotype (CK), inv(16), t(11q23), t(15;17), t(8;21) or nBM was obtained from GSE13204. (F) The relative expression of P2X7 in B-ALL with t(11q23), AML with t(11q23) and nBM was obtained from GSE13204. The dashed lines in (A) and (E) represent the median P2X7 expression in nBM (y=0.28). Bars represent the mean ± standard error of mean. *P<0.05; **P<0.01; ***P<0.001; unpaired Student t test and one-way analysis of variance.
1280
haematologica | 2021; 106(5)
