
Page 87 - 2021_04-Haematologica-web
P. 87
Asxl1 lesions collaborate with CEBPA-p30 in AML
ABC
DE
FGH
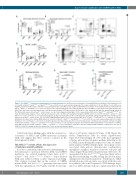
Figure 2. The ASXL1G643W variant has minimal impact on normal hematopoiesis. (A) Fluorescence-activated cell sorting (FACS)-based analysis of the peripheral blood of 6-month old Asxl1+/+, Asxl1G643W/+ and Asxl1G643W/G643W mice (n>11 mice in each experimental group). The relative distribution of B cells (B220), T cells (CD3), neu- trophilic granulocytes (Mac1-Gr1) and other monocytic/granulocytic cells (Mac1) was analyzed. (B) FACS-based analysis of the peripheral blood of 18-month old Asxl1+/+, Asxl1G643W/+ and Asxl1G643W/G643W mice (n>5 mice in each experimental group). The relative distribution of B cells (B220), T cells (CD3), neutrophilic granulocytes (Mac1-Gr1) and other monocytic/granulocytic cells (Mac1) was analyzed. (C) Representative FACS profiles of the data from (A-B) with the gating strategy indicated. The FACS profile represents an Asxl1+/+ control mouse. See the Online Supplementary Figure S1 for representative FACS plots of Asxl1G643W/+ and Asxl1G643W/G643W ani- mals. (D) FACS-based analysis of bone marrow hematopoietic stem cell (HSC) and multipotent progenitor (MPP) subsets in 6-month old Asxl1+/+, Asxl1G643W/+ and Asxl1G643W/G643W mice (n>5 mice in each experimental group). (E) Representative FACS profiles of the data from (D) with the gating strategy indicated. The FACS profile represents an Asxl1+/+ control mouse. See the Online Supplementary Figure S1 for representative FACS plots of Asxl1G643W/+ and Asxl1G643W/G643W animals. (F) Lineage distribution of mature bone marrow (BM) subsets in 6-month old Asxl1+/+, Asxl1G643W/+ and Asxl1G643W/G643W mice (n>5 mice in each experimental group). The relative distribution of B cells (B220), T cells (CD3), neutrophilic granulocytes (Mac1-Gr1) and other monocytic/granulocytic cells (Mac1) was analyzed. (G) Spleen weights of 18-month old Asxl1+/+, Asxl1G643W/+ and Asxl1G643W/G643W mice (n>5 mice in each experimental group). (H) Competitive BM transplantation of 1:1 mixtures of CD45.2 donor BM cells from 6-month old Asxl1+/+, Asxl1G643W/+or Asxl1G643W/G643W mice and CD45.1 competitor cells into lethally irradiated CD45.1 recipient mice. The ratio of CD45.2 to CD45.1 in peripheral blood is depicted (n>7 mice in each experimental group).
Collectively, these findings agree with the observed co- occurrence of ASXL1 and CEBPA mutations in human AML and suggest that these lesions co-operate in the development of AML.
The ASXL1G643W variant affects the expression of leukemia relevant pathways
In order to understand the molecular underpinnings of the functional co-operation between ASXL1 and CEBPA mutations, we isolated leukemic blasts from Asxl1+/+; CebpaD/p30 and Asxl1G643W/G643W; CebpaD/p30 donor-derived AML and subjected them to gene expression profiling. This analysis revealed that in the context of CEBPA mutant AML, the Asxl1G643W/G643W genotype was associated with the upregulation of 177 genes and the down-regu-
lation of 279 genes (adjusted P-value <0.05; Figure 4A, Online Supplementary Table S1, Online Supplementary Figure S3A). Interestingly, 18 of 30 of the most upregulat- ed genes encoded pseudogenes, perhaps reflecting a role for ASXL1 in mediating their repression. Gene set enrich- ment analysis (GSEA) identified gene ontology processes associated with mitosis (chromosome condensation, metaphase/ anaphase transition of mitotic cell cycle and others; Figure 4B and Online Supplementary Table S2) to be up-regulated in the Asxl1G643W/G643W genotype likely reflect- ing the recent finding of ASXL1 being involved in main- taining sister chromatid separation.27 Furthermore, GSEA identified gene ontology terms associated with ribosome biosynthesis (ribosome biogenesis), DNA damage (regu- lation of DNA damage response, signal transduction by
haematologica | 2021; 106(4)
1003
