
Page 199 - 2021_04-Haematologica-web
P. 199
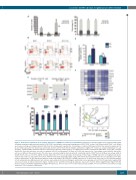
Leukemic GATA1s delays megakaryocyte differentiation
A
B
E
C
D
F
G
Figure 6. Hemopoietic populations in the yolk-sac. Expansion of GATA1s P3 relative to P4 populations. (A) Bar plot of absolute number (left) and percentage (right) of primitive progenitors with myeloid potential (CD16-CD32-) and definitive erythro-myeloid progenitors (CD16+CD32+) in day 6 (d6) EB-derived kithiCD41lo cells. Shown are mean percentage ±1 standard deviation (SD) from three independent experiments. Cell genotype is indicated. (B) Representative flow cytometry analysis plot of kit and CD41 expression from bioG1 (top) and bioG1s (bottom) at E9.5 (left), E10.5 (middle) and E11-11.5 (right) (n=5-7 yolk sacs analyzed individually for each genotype). P1-P4 and DN populations indicated. (C) Box plot of absolute number/yolk sac of erythroid (left, Ter119+) and myeloid (right, Mac1+ and/or Gr1+) in bioG1 and bioG1s. Each dot represents one yolk sac analyzed at E10.5 (n=5/genotype). (D) Ratio of P3/P4 cells expressed as a percentage (y-axis) in bioG1 and bioG1s yolk sacs at different time points (x-axis). The ratios were calculated using the data shown in B, considering only the CD41hi fraction. (E) Mean percentage ±1SD of CD42b+ E10.5 yolk sac cells in P3 and P4 in bioG1 and bioG1s (n=5 for each genotype). (F) Heatmap of fold change of mRNA expression of megakaryocytic genes (rows) in E10.5 yolk sac cells purified from P1 to P4 from bioG1 (left) and bioG1s (right). Cells purified from two independent litters for each genotype, in two inde- pendent experiments. (G) Two dimensional principal component analysis (2D-PCA) plot of mRNA expression of 23 genes from either yolk sac cells (shaded symbols) or from embryoid bodies (EB)-derived in vitro cultures (open symbols), from bioG1 (triangles) and bioG1s (circles) genotypes, from P1 to P4 and double negative (DN) cells (colour coded as indicated below the figure). Conditions were performed in biological duplicates. Data taken from the Online Supplementary Figure S5F (EB- derived cultures) and Online Supplementary Figure S6H (yolk sac). *P<0.05 and ***P<0.001 between bioG1s and BirA. #P<0.05 and ###P<0.001 between bioG1s and bioG1. $$$P<0.01 between P4 and P3.
haematologica | 2021; 106(4)
1115
