
Page 201 - 2021_04-Haematologica-web
P. 201
Leukemic GATA1s delays megakaryocyte differentiation
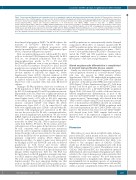
Figure 7. (previous page) Megakaryocytic maturation defect is recapitulated in patients with transient myeloproliferative disorder. (A) Representative contour flow cytometry plots of live, CD235a negative cells at day 6 (d6), d9, d12 and d15 of megakaryocytic differentiation assessed by kit (y-axis) and CD41 (x-axis) expression. CB refers to human neonatal GATA1 wild-type (WT) cells ; T21 refers to trisomy for chromosome 21 (T21) and GATA1 WT; TMD1 refers to T21 with a GATA1s mutation (exon2:c.G220C:p.V74L), variant allel frequency (VAF)=10.3 % of mononuclear cells (MNC); TMD2 refers to T21 with a GATA1s mutation (exon2:c.108_109del:p.S36fs ), VAF=9.2% of MNC. Numbers within gates are the mean percentage ± 1 standard devaitaion (SD) of cells from three culture exper- iments performed in parallel for each sample. (B) Representative contour plots of live, CD235a negative cells at d15 of megakaryocytic maturation assessed by CD42b (y-axis) and CD41 (x-axis) expression for (from left to right) CB, T21, TMD1 and TMD2. Numbers within gates are as in A. (C) Plots comparing the percentage of kit positive cells (left), the mean fluorescence intensity (MFI) (middle) or both (right) in mature megakaryocytes defined as CD41+CD42b+ in the same set of sam- ples. The unpaired t-test was used for statistical analysis. *P<0.05, **P<0.01 and P***<0.001.
throid-myeloid progenitors (EMP).20 In d6 EB cultures, the majority of kithiCD41lo hemopoietic cells were CD16+CD32– primitive erythroid progenitors with myeloid potential (Figure 6A; Online Supplementary Figure S6A-C) consistent with previous reports.20
Next, we analyzed hemopoietic cells from E9.5 to E11.5 yolk sac for kit and CD41 expression (Figure 6B). In E9.5 yolk sac, we identified populations with the same immunophenotypic profile as P1 to P4 and DN (kit-CD41-) populations seen in vitro in cultures, in both bioG1 and bioG1s embryos. From E9.5 to E11.5, the DN population was sustained in both bioG1 and bioG1s yolk sac. We then purified this population and quantitated the absolute number of cells/yolk sac (Figure 6C; Online Supplementary Figure S6D-F). Absolute numbers of DN cells were far lower in bioG1s yolk sac, with a significant- ly marked reduction in Ter119+ cells and increase in Mac1+/Gr1+ cells consistent with data from EB-derived cultures.
Turning to P1-P4 populations, there was a reduction of P1-P2 populations at E10.5, which virtually disappeared by E11-11.5 with mainly P3 and P4 populations present. Importantly, in bioG1s, there was a significant increase in P3 relative to P4 at each time point (E9.5-E11.5) and sus- tained higher levels of P3 cells at E11-11.5, mirroring in vitro culture data (Figure 6B, D). Purified P3 and P4 pop- ulations contained CD42b+ cells (Figure 6E; Online Supplementary Figure S6D, E, G). In control bioG1 cells there were significantly more CD42b+ cells in P4 than P3, consistent with megakaryocyte maturation in P4. This was not the case in bioG1s P4 cells, consistent with aber- rant, reduced megakaryocyte maturation. We also tested mRNA expression in purified E10.5 P1-P4 cells (Figure 6F). In bioG1 cells megakaryocytic gene expression (most noticeable for Ppbp, Vwf, Pf4, Tbxas1) increased progres- sively from P1/P2 to P3 then to P4. In contrast, in bioG1s cells expression of these genes did not increase from P3 to P4 cells, consistent with a megakaryocyte maturation defect. In order to ultimately confirm that the populations derived from the yolk sac were related to the ones identi- fied from the EB model we performed a two-dimensional principal component analysis (PCA) (Figure 6G). Expression profiles of a panel of genes were interrogated by Fluidigm in DN and P1-P4 EB- and yolk sac-derived populations in both bioG1 and bioG1s (Online Supplementary Figures S5F, S6H). The genes were carefully selected for their well known role in specific hemopoietic lineages (Online Supplementary Table S2). The PCA was first performed on the EB population using prcomp func- tion (PCA analysis using TRUE for the scale parameter). The yolk sac populations were then projected using the function predict. The most important finding was that yolk-sac and EB-derived DN and P1-P4 populations clus- tered together, consistent with the notion that the yolk sac
and EB populations are transcriptionally similar. Principal component 1 (PC1) (51% of variance) separated the P3 and P4 populations (genes whose expression contributed most to variance were the megakaryocyte genes – Tubb1, Factor V, Gp9 and Pf4) whereas PC2 (32% of variance) sep- arated the P1-P2 and DN populations (genes whose expression contributed most to variance were the ery- throid genes – Klf1, Epor, and globin genes).
Altered megakaryocytic differentiation is recapitulated in transient myeloproliferative disease samples
Finally, we asked if the amplified immature megakary- ocytic population observed in in vitro EB-derived Gata1s cells was also present in TMD patients (Online Supplementary Table S3). We analyzed the megakaryocytic differentiation of human cord blood CD34+ cells cultured in presence of thrombopoietin (TPO) and stem cell factor (SCF) (Figure 7; Online Supplementary Figure S7). Cells from disomic cord blood gave rise to kithiCD41loCD42b– cells that then matured into a kitloCD41hiCD42b+ population (Figure 7A-B). Cells from T21 cord blood showed an exac- erbated megakaryocytic differentiation, as most of the cells were kitloCD41hiCD42b+ by d12, in accordance with a previous report.21 Interestingly, cells derived from both TMD cord blood (harbouring a Gata1s mutation in around 10% of mononuclear cell [MNC]) showed an accumula- tion of the immature kithiCD41loCD42b– population with a decreased maturation into kitloCD41hiCD42b+ cells com- pared to T21-derived cells. Moreover, kitloCD41hiCD42b+ cells derived from both TMD samples harboured an increased level of kit expression compared to controls (Figure 7C), suggesting an altered megakaryocytic matura- tion.
Discussion
Our studies of a new knock-in GATA1s allele, in hemo- poiesis from ESC and in murine yolk sacs, define the cel- lular mechanisms leading to a developmental-stage specif- ic megakaryocyte myeloproliferation that likely con- tributes to the oncogenic effect of GATA1s. GATA1s results in a 10-fold increase in megakaryocytic cells from ESC cultures compared to control. Though prior work on GATA1s TMD-derived iPSC also demonstrated erythroid differentiation arrest and enhanced megakaryocyte differ- entiation, the stage in hemopoiesis where perturbed dif- ferentiation occurs was unclear.13 We now demonstrate that accumulation of megakaryocytic lineage cells occurs predominantly late in megakaryopoiesis, at an immature megakaryocyte precursor stage (where most cells are 2N), within a specific compartment (termed P3), characterized
haematologica | 2021; 106(4)
1117
