
Page 198 - 2021_04-Haematologica-web
P. 198
G. Juban et al.
A
B
C
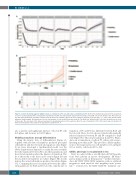
Figure 5. Cell fate modeling suggests GATA1s enhances cell division in P3 cells and reduces commitment to P4. (A) Fit of the mathematical model to the proportions of cells in each population (three independent experiments for BirA, four independent experiments for bioG1s). Top, BirA cells, below, bioG1s cells. The points are the data taken from Figure 2 and the solid line is the model fit. The shaded region is the 95% Confidence Interval (CI) for the data – i.e., 95% of the data should lie within the shaded region. (B) Growth curve for the total number of cells modeled from the model fit. Top, BirA cells, below, bioG1S cells. Note the difference in scale of the y-axis. The error bars of the data are two-times the standard deviation of the replicates. Note the rate of transition of P3 to P4 is much lower for bioG1s. (C) Inferred cell transition rates between the populations and their 95% CI.
also a specific, and significant, increase of bioG1s P3 cells in S-phase and decrease in G1/G0 phase.
Modeling transitions through differentiation
Using the kinetic data of differentiation (Figure 2), together with absolute cell numbers produced per initial cell numbers and the cell cycle and apoptosis data (Figure 4) we have developed a mathematical model (see the Online Supplementary Appendix) to study the rates at which the cells transition between P1 to all other populations and how Gata1s mutation alters the kinetics of transition. The fit of the model to the data can be seen in Figure 5A and the modeled cell numbers in culture (Figure 5B) closely mirrors the actual cell numbers produced in culture (Figure 1G). Comparing the rates of transition between the differ- ent populations, for BirA and bioG1s cells, only the rate of
transition of P3 and P4 was different between BirA and bioG1s cells. Here, bioG1s showed statistically markedly reduced transition between P3 and P4 compared to BirA cells (Figure 5C). This slower transition from P3 to P4 pro- duces an accumulation of cells in P3, where cells are pro- liferating more than in P4. This provides a likely explana- tion for the large increase in cell numbers seen in Figure 1G for bioG1s cells from d10 to d12.
GATA1s phenotype is recapitulated in vivo
Next, we asked if the in vitro EB-derived P1-P4 popula-
tions were present in mouse development. EB hemo- poiesis mimics yolk sac hemopoiesis17,18 in that it first pro- duces kit+CD41+CD16–CD32– primitive yolk sac erythroid progenitors with myeloid and megakaryocytic poten- tial,17,19 followed by kit+CD41+CD16+32+ definitive ery-
1114
haematologica | 2021; 106(4)
