
Page 197 - 2021_04-Haematologica-web
P. 197
Leukemic GATA1s delays megakaryocyte differentiation
AC
BD
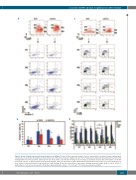
Figure 4. Increased proliferation and decreased apoptosis in GATA1s P3 cells. (A) Flow cytometry analysis, from one representative experiment (of three independent experiments) at day 8 (d8), showing kit and CD41 expression of BirA (left) and bioG1s (right) cells (top). P1 to P4 populations indicated. Below, Annexin V and Hoechst staining within P1 to P4 populations. (B) Bar plot of data from all three experiments showing mean percentage ±1 standard deviation (SD) of AnnexinV+ cells in BirA and bioG1s cultures. (C) Representative flow cytometry analysis, from one experiment (of three independent experiments) at d9. Details as set out in (A). Below, cell cycle analysis determined by EdU incorporation and 7-AAD staining. (D) Bar plot from all three experiments showing mean percentage ±1SD of cells in G0/G1, S, G2/M phases of cell cycle and cells with >4N ploidy, in BirA and bioG1s cultures. *P<0.05 and **P<0.01 between bioG1s and BirA
haematologica | 2021; 106(4)
1113
