
Page 144 - 2021_04-Haematologica-web
P. 144
Y. Shi et al.
A
B
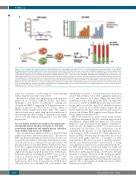
Figure 3. Loss of lymphocyte cell-specific kinase (LCK) negatively effects propagation potential of the T-cell acute lymphoblastic leukemia (T-ALL) cell line MOLT4 and patient-derived xenograft (PDX) L963 in vivo. (A) Volcano plot derived from the functional in vivo screen representing the magnitude of the fold change (log2) in shRNA abundance derived from leukemia cells isolated from the spleen of PDX L963 on the x-axis. Each dot represents an individual shRNA construct. The y-axis represents the significance in enrichment or depletion of shRNA constructs (log10 scale). Three dots (shLCK#3, shRPL9#1 and shCD19#2) above the blue line are significantly depleted (P<0.05). Bar plot of the normalized shLCK#3 sequencing reads (log2) in leukemic cells derived from the bone marrow (orange) or spleen (blue) of six individual mice (M1-6), relative to the frequency of these reads before transplantation (green, base line B1-3). (B) Schematic representation of the in vivo com- petitive outgrowth assay. MOLT4 cells were lentivirally transduced with shNTC (red fluorescent protein, RFP) or shLCK#3 (GFP) and intrafemorally injected into five NSG mice in a 1:1 ratio. Mice were culled once symptomatic and the ratio of RFP : GFP positive human leukemic cells in spleen (n=5), bone marrow (n=3) or liver (n=3) determined by flow cytometry. In all mice, the MOLT4 cells carrying shLCK#3 were outcompeted by shNTC cells during engraftment in spleen, marrow and liver. Student's t-test: *P<0.05, ***P<0.005, ****P<0.001.
arrest was observed, corroborating our earlier findings (Online Supplementary Figure S4C and D).
Knockdown of LCK was analyzed for early apoptosis induction in CUTLL1, MOLT4, SUPT1 and Jurkat. Although a clear increase in Annexin V staining was observed in MOLT4, suggesting LCK knockdown led to apoptosis, this was not observed in CUTLL1, Jurkat or SUPT1 (Online Supplementary Figure S4E). This suggests that cell cycle arrest, rather than apoptosis induction, is the predominant effect leading to diminished cell expan- sion in vitro and reduced propagation in vivo after LCK knockdown.
Tyrosine kinase inhibitor dasatinib blocks lymphocyte cell-specific kinase function and leads to cell cycle arrest while lymphocyte cell-specific kinase activation levels predict response to its inhibition
The tyrosine kinase inhibitor DAS is a dual SRC/ABL inhibitor known to effectively inhibit LCK.21 The effect of DAS on LCK protein expression and activation status was assessed by western blot, after demonstrating near univer- sal LCK activation as evidenced by tyrosine residue 416 phosphorylation in cell lines (Online Supplementary Figure S1G). We confirmed that DAS effectively abolished acti- vated p-Y416SRC in all four T-ALL cell lines tested, whilst slightly decreasing total LCK protein levels. Furthermore,
well as a decrease in p-Y783PLCγ1 and p-Y493ZAP70, two downstream targets of LCK (Figure 5A and Online Supplementary Figure S5A). As knockdown of LCK leads to cell cycle arrest, we performed cell cycle analyses after
administration of DAS. Cell cycle arrest was observed in all six T-ALL cell lines tested, with a significant increase in G0/G1 and decrease in S phase (Figure 5A and Online Supplementary Figure S5B). In parallel, PDX cells supported by in vitro co-culture with OP9-DL1 were exposed to DAS. In line with our cell line data, DAS abolished activated p-Y416SRC levels in all six PDX samples (Figure 5B and Online Supplementary Figure S5C) and cell cycle arrest was observed in all three PDX samples tested (Figure 5B and Online Supplementary Figure S5D).
LCK dephosphorylation of inhibitory p-Y505 was noted, as
(median of 1.2 mM). However, in this setting, no signifi- cant correlation between the GI50 and p-Y416SRC/LCK ratio was identified, suggesting that DAS sensitivity of patient- derived cells is dependent on additional factors (Online Supplementary Figure S5E).
The in vitro sensitivity of a panel of nine T-ALL cell lines to DAS was determined. The IC observed ranged from 5
50
nM (HSB2) to 15 mM (MOLT16) (Figure 5C). The cell line
HSB2 not only demonstrated the highest sensitivity to
DAS but also the highest p-Y416SRC activation level as
determined by Phosflow. This observation can be
explained by the presence of a t(1;7)(p34;q34) transloca-
tion leading to LCK activation by TCRβ enhancer ele-
ments in HSB2. We thus hypothesized that the level of
activated LCK might represent a biomarker for DAS
responsiveness. Phosflow was used to quantify and calcu-
late the ratio between p-Y416SRC and total LCK. A strong
and significant correlation was observed between the IC50
for DAS and the ratio of activated Y416SRC in T-ALL cell
lines (R =0.778, P=0.004) (Figure 5C). The sensitivity of 2
PDX cells to DAS ranged from GI of 23.8 nM to 19.7 mM 50
1060
haematologica | 2021; 106(4)
