
Page 93 - 2021_03-Haematologica-web
P. 93
Alternative splicing in multiple myeloma
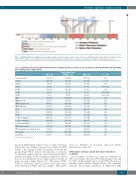
Figure 2. SF3B1 mutations in multiple myeloma patient samples. A lollipop diagram of the location of non-silent SF3B1 mutations in the dataset. The hotspot muta- tions of K666 and K700 are marked in red, other non-silent mutations are marked in blue, and splice site mutations in purple. Key domains are labeled.
Table 2. Significant clinical and genomic characteristics of multiple myeloma in relation to the low (20th), medium (20th-80th), and high (80th) novel splicing patient sample groups.
No translocation
t(11;14)
t(14;16)
t(14;20)
t(4;14)
t(6;14)
t(8;14)
HRD
IMWG low risk IMWG standard risk IMWG high risk
ISS I
ISS II
ISS III
0-4 driver mutations
5-9 driver mutations
10+ driver mutations
MYC translocations
TP53 inactivation (1 or both alleles) 1q gain/amp
1p deletion
n: number; NS: not significant.
Low % (n)
63% (76)
12% (14) 3% (3) 2% (2) 19% (23) 2% (2) 0% (0) 65% (68) 6% (6) 75% (80) 19% (20) 35% (40) 39% (45) 26% (30) 45% (54) 49% (59) 6% (7) 33% (38) 10% (10) 28% (29) 6% (6)
Novel splicing level Medium % (n)
60% (215)
18% (65) 5% (19) 1% (5) 14% (49) 0% (1) 1% (4) 59% (194) 11% (38) 74% (247) 14% (48) 35% (122) 37% (129) 27% (95) 30% (107) 56% (202) 14% (49) 26% (87) 10% (32) 36% (118) 10% (32)
High % (n)
51% (61)
32% (38) 3% (4) 3% (3) 5% (6) 5% (6) 2% (2) 55% (60) 10% (11) 77% (85) 13% (14) 27% (32) 37% (44) 36% (42) 37% (44) 48% (57) 16% (19) 25% (28) 18% (20) 23% (25) 12% (13)
P, χ2 test NS
<0.001 NS Not tested 0.002 Not tested Not tested NS NS
NS
NS
NS
NS
NS 0.041 NS 0.016 NS 0.019 NS
NS
that had differentially spliced exons or splice junctions (Figure 3A). The change in proportion of spliced-in (PSI) events is the change in relative abundance between the groups (Figure 3B). It indicates the inclusion or exclusion of a particular splice junction or exon. Unsupervised hier- archical clustering on the normalized expression shows the use of an alternative exon or splice junction for the 18 genes in each sample (Figure 3C). The genes MZB1, DYNLL1, TMEM14C, OXA1L, SESN1, and UQCC1 have been identified in MDS and CLL samples. These genes
show no difference in total gene expression (Online Supplementary Figure S3).
Differential splicing caused by hotspot mutations in SF3B1
In an analysis of splice site usage, we identified 39 (10%) novel splice sites, 153 (38%) known splice sites and 211 (52%) differentially used exons (P<0.05). The types of splicing events include: Skipped Exons (SE), Mutually Exclusive Exons (MX), Alternative 5’ Splice-sites (A5),
haematologica | 2021; 106(3)
739
