
Page 91 - 2021_03-Haematologica-web
P. 91
Alternative splicing in multiple myeloma
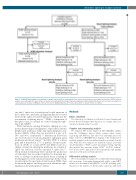
Figure 1. CONSORT flow diagram of breakdown of sample subsets used for each analysis. Four subsets of the data were used, which included the SF3B1 mutation analysis, novel splicing in the entire dataset, as well as novel splicing in the multiple myeloma subgroups t(4;14) and t(11;14). Reasons for exclusion of samples for each analysis are provided. CoMMpass: Clinical Outcomes in Multiple Myeloma to Personal Assessment of Genetic Profile; n: number.
site; the 3’ splice site; a branch point located upstream of the 3’ splice site; and lastly a polypyrimidine tract located between the splice site and branch point, which aids the recruitments of splicing factors.9,10 SF3B1, a component of the spliceosome, is essential for correct binding and splic- ing of pre-mRNA.
SF3B1 mutations causing alternative splicing are com- mon in hematological malignancies, especially in chronic lymphocytic leukemia (CLL) and myelodysplastic syn- dromes (MDS), where they are mutated at a rate of 5- 18% and 30%, respectively.11-14 Mutation in SF3B1 has also been shown to result in alternative splicing in uveal melanoma and breast cancer.15,16 In MM, SF3B1 is a driver gene and is mutated in 1.7% of patients. Hotspot muta- tions in SF3B1 at codons K700 and K666 result in a change-of-function, altering the preference for a cryptic 3’ splice site selection over the canonical 3’ splice site.17,18 The potential downstream effects include the production of transcripts that are either translated to abnormal pro- teins or undergo nonsense-mediated decay resulting in downregulation of the canonical transcript. In this work, we investigate the spectrum of mutations in SF3B1, their downstream impact, and the greater role alternative splic- ing plays in the pathogenesis of MM.
Methods
Ethics statement
The University of Arkansas for Medical Sciences Institutional Review Board determined that this project is exempt and is not classified as human subject research.
Samples and sequencing analysis
We analyzed 598 newly diagnosed MM (NDMM) samples from the CoMMpass dataset which contains whole exome sequencing and RNA-seq data that were uniformly processed. Figure 1 shows a CONSORT flow diagram of the breakdown of available samples for the four different analyses performed on the data. WES data were analyzed for mutations using a previously described pipeline.1,19 RNA-seq data was analyzed using a pipeline that included the transcript aligner STAR20 (v2.5.1b). Salmon21 (v0.7.2) was used to align reads to the transcriptome and quantify expression at the gene and transcript level.
Differential splicing analysis
We took a multifaceted approach to identify differential splicing and exon usage. Sequencing alignment and quality control (QC) metrics were determined using QoRTs22 (v1.2.42), including quan- tification of the number of known splice junctions (annotated
haematologica | 2021; 106(3)
737
