
Page 92 - 2021_03-Haematologica-web
P. 92
M.A. Bauer et al.
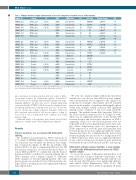
Table 1. Multiple myeloma sample characteristics used in the comparison of controls versus SF3B1 mutants.
Sample ID
MMRF_2326
MMRF_2240 MMRF_2365 MMRF_2497 MMRF_2035 MMRF_1796
MMRF_2220 MMRF_1780 MMRF_1683 MMRF_2082 MMRF_2458 MMRF_2093 MMRF_1157 MMRF_1512 MMRF_1446 MMRF_1860 MMRF_2339 MMRF_1029 MMRF_1695 MMRF_1210 MMRF_1462
MMRF_1855
Group
SF3B1_mut
SF3B1_mut SF3B1_mut SF3B1_mut SF3B1_mut SF3B1_mut
SF3B1_mut SF3B1_mut SF3B1_mut SF3B1_mut SF3B1_mut Control Control Control Control Control Control Control Control Control Control
Control
TC
t(4;14)
t(11;14) t(11;14)
t(4;14) t(11;14) t(14;16)
t(11;14) t(4;14) t(11;14)
t(11;14) t(11;14) t(11;14)
t(4;14) t(14;16)
HRD IMWG risk
nHRD Standard risk
nHRD Standard risk nHRD Standard risk nHRD Standard risk HRD Standard risk HRD Standard risk
nHRD Standard risk nHRD Standard risk nHRD Standard risk HRD Standard risk nHRD Standard risk nHRD High risk nHRD Standard risk HRD Standard risk nHRD Standard risk nHRD Low risk nHRD Low risk
HRD Low risk
nHRD Standard risk
HRD Standard risk
nHRD Standard risk
nHRD Standard risk
ISS
I
III III I III I
II III II I II II I II I II I I III
TC6 calls
MMSET
CCND1 CCND1 D2 D2 D2
MMSET CCND1 MAF D2 CCND1 MMSET CCND1 D1 CCND1 CCND1 CCND1 D2 D1
Protein change VAF
p.K666T 0.39
p.K666Q 0.26 p.K700E 0.29 p.K666T 0.21 p.K666T 0.35 p.S908L, 0.65, p.S851C 0.44 p.W938C 0.25 p.F1202C 0.19 p.M784I 0.57 p.V727L 0.34 p.D894H 0.36
I D1
I MMSET
I MAF
TC: translocation; HRD/nHRD: hyperdiploid/non-hyperdiploid; IMWG Risk: International Myeloma Working Group Risk; IIS: International Staging System (multiple myeloma prog- nosis);TC8:translocation Cyclin-D classification;VAF:variant allele frequency.
splice junctions), novel splice junctions and read counts of differ- ent genomic features for downstream analysis. JunctionSeq23 (v1.10.0) was used to perform differential splicing and exon usage. Similarly, DEXSeq24 (v1.26.0) was used to identify differential exon usage. Finally, SUPPA225 (v2.2.2) was used to identify alterna- tive splicing and the type of splicing event. lncScore26 (v1.0.2) was used to calculate the coding potential of transcripts with novel splice junctions and provides a call of non-coding or coding. A score closer to one is an indication of the confidence of it being protein coding.
Additional details of the pipelines and software used for data analysis are available in the Online Supplementary Appendix.
Results
Hotspot mutations are associated with differential splicing
We identified non-synonymous SF3B1 mutations in 1.7% (n=21) of NDMM samples. The mutations consisted of 21 missense and one splice site mutation (one sample had 2 mutations) (Figure 2). Of the 21 samples with mutated SF3B1, 11 had accompanying RNA-seq data. Of the missense mutations, six were in known hotspots at codons K666 and K700. To confirm that only the hotspot mutation in SF3B1 contributed to aberrant splicing, the 11 SF3B1 mutants were compared against 11 wild-type SF3B1 samples for aberrant splicing patterns. The com- parator group was matched for key MM molecular sub- types (Table 1) resulting in just four significantly differen- tially spliced genes.
We went on to analyze samples with hotspot mutations and the five (one did not have RNA-Seq data) samples with such mutations were compared to the original con- trol group of 11 samples. This analysis showed a marked increase in the number of significant differentially spliced events after multiple testing correction (435 significant splicing events compared to just four using all SF3B1 mutants). The median variant allele frequency (VAF) for the SF3B1 missense mutations was 0.3 (range 0.1-0.64). There was no significant difference in the median VAF between hotspot and non-hotspot mutations in SF3B1, suggesting clonal versus sub-clonal mutations were not responsible for the lack of splicing in the non-hotspot sam- ples (Online Supplementary Figure S1). Investigation of SF3B1 expression at both the gene and transcript level between groups showed no significant difference (Online Supplementary Figure S2), confirming that the detected dif- ference in splicing was also not due to a change in the level of SF3B1 expression. There was no significant difference in any other recurrent non-synonymous gene mutations between the hotspot SF3B1 mutant and the control group.
Differential splicing analysis identifies a large number of significantly differentially spliced events in SF3B1 mutant samples
To assess the extent of differential splicing three tools were used each looking at different components of the splicing process. Comparing SF3B1 mutants with the con- trols showed that 953 genes were significantly differen- tially spliced (Online Supplementary Tables S1-S5). The intersection of these three methods identified 18 genes
738
haematologica | 2021; 106(3)
