
Page 275 - 2021_03-Haematologica-web
P. 275
Case Report
A
BC
DE
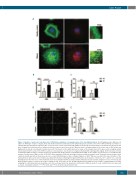
Figure 3. Analysis of podosome formation and of SDF1-driven migration of megakaryocytes of the investigated patient. (A-C) Megakaryocytes (Mk) were let adhere to fibrinogen or type I collagen, fixed, and double-stained for polymerized actin (phalloidin, green) and the active form of SRC (antibody selectively rec- ognizing SRC phosphorylated at Tyrosine-419, red). Scale bars: 10 μm. (A) Patient’s Mk exhibited a markedly increased number and density of podosomes that were recognized as actin-based focal adhesion structures (green); moreover, patient’s Mk presented a strong positivity for the active form of SRC, which was highly and selectively concentrated in podosomes (red). The inserts on the right represent a merge of the images taken in the green and red signals, which demonstrates that the active form of SRC localizes in correspondence of podosomes recognized by phalloidin staining (yellow signal). (B,C) Podosomes formed on fibrinogen (FBG) and type I collagen (COLL) were quantified by image analysis of phalloidin-labelled Mk, as the number of podosomes per each Mk and the number of podosome per Mk area unit. (D-E) SDF1-driven migration of Mk was investigated using a modified transwell assay. Transwell systems having a poly- carbonate membrane with an 8 mm pore size were coated with fibrinogen or type I collagen. Aliquots of 4x10³ Mk were seeded in the upper chamber of the transwell insert, whereas the lower chamber was filled with medium containing 100 ng/mL SDF1. After an incubation of 16 hour at 37°C and 5% CO2, cells that had migrated to the lower face of the membrane were fixed and labeled with an anti-β1-tubulin antibody (red) and counted using fluorescence microscopy. (D) Representative images of microscopic fields of migrated cells. Scale bars: 60 mm. (E) Mk migration was quantified as the number of migrated Mk per field by analyzing the entire polycarbonate membrane area. For each experiment, the assays were performed in triplicate wells for each condition. Data are expressed as means ± standard deviation. ****P<0.0001 and **P<0.01 by two-tailed Student t-test.
haematologica | 2021; 106(3)
921
