
Page 119 - 2021_03-Haematologica-web
P. 119
Slc35a1 deficiency and thrombocytopenia
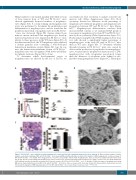
Hematoxylin & eosin-stained, paraffin-embedded sections of bone marrow from of WT and Plt Slc35a1–/– mice showed significantly decreased numbers of megakaryo- cytes (Figure 5A). A colony-forming unit-megakaryocyte assay was performed to determine the proliferation and differentiation of megakaryocytes, and we found that the proliferation potential of megakaryocytes from Plt Slc35a1– /– mice was decreased (Figure 5B). Giemsa-stained bone marrow smears indicated that megakaryocyte develop- ment and maturation were impaired in Plt Slc35a1–/– mice relative to these processes in the WT mice (Figure 5C). At the ultrastructural level, the WT megakaryocytes exhibited a distinct granular zone containing a well-developed demarcation membrane system (Figure 5D, top). In con- trast, the demarcation membrane system of Plt Slc35a1–/– megakaryocytes was disorganized with fewer well-delim- ited platelet territories (Figure 5D, bottom).
To determine which developmental stages of megakaryocytes are affected by the loss of Slc35a1, we
used multicolor flow cytometry to analyze isolated bone marrow cells (Online Supplementary Figure S10). Flow cytometry detected no difference in the percentage of megakaryocyte/erythroid progenitors and megakaryocyte progenitors between WT and Plt Slc35a1–/– mice (Figure 6A).35,36 Megakaryocyte differentiation correlates with increased DNA content, so we examined DNA ploidy of bone marrow megakaryocytes from WT and Plt Slc35a1–/– mice by flow cytometry (Online Supplementary Figure S11). Ploidy analysis using Hoechst33342 staining on bone mar- row cells showed a significantly higher percentage of megakaryocytes at the early 2N stage in Slc35a1–/– mice than in WT mice (Figure 6B). To determine whether thrombocytopenia in Plt Slc35a1–/– mice was caused by defects in the production of proplatelets from megakaryo- cytes, we performed a proplatelet formation assay. CD41+ megakaryocytes with cytoplasmic pseudopods longer than the diameter of cytoplasm were defined as pro- platelet-forming megakaryocytes (Figure 6C). Fibrinogen-
AD
B
C
Figure 5. Plt Slc35a1–/– mice exhibit decreased megakaryocyte counts and defective megakaryocytopoiesis in bone marrow. (A) Representative images of hema- toxylin & eosin-stained wild-type (WT) and Plt Slc35a1–/– bone marrow (BM) paraffin-embedded sections (left). Analysis of BM megakaryocyte counts per image of WT and Plt Slc35a1–/– mice (right). Three images/mouse of 12 mice per genotype. Arrows mark megakaryocytes. Data are means ± standard deviation (SD). Scale bar, 20 mm. (B) The colony-forming unit-megakaryocyte assay. Colonies were enumerated using an inverted microscope (right). Colonies were also stained with anti- CD41 antibody and detected by flow cytometry (left). Data are means ± SD. WT, n=10; Plt Slc35a1–/–, n=6. (C) Analysis of different stages of megakaryocytes using BM smears stained with Giemsa from WT (n=6) and Plt Slc35a1–/– (n=6) mice. Data are means ± SD. Scale bar, 20 μm. (D). Representative transmission electron microscopy micrographs of BM megakaryocytes (n=3 for WT and Slc35a1–/– mice, respectively). Scale bar, 2 mm. ***P<0.001.
haematologica | 2021; 106(3)
765
