
Page 105 - 2021_03-Haematologica-web
P. 105
Erythroid mRNA translation in RPS14 deficiency
lentiviral vector (Figure 1D). Consistent with our human primary cell model and patient data, the GATA1 protein expression level was found to be decreased without any change in the transcript level (Figures 1E and Online Supplementary Figure S1D). After shRPS14 induction, pro- liferation was decreased, as evidenced by the accumula- tion of the cells in G1 phase and the induction of apopto- sis, and membrane GPA expression was diminished (Online Supplementary Figure S1E-H). Transcriptome analy- sis of the UT-7/EPO shRPS14 cell lines indicated a signifi- cant modulation of GATA1 target genes including a decreased expression of the majority of activated GATA1 targets and an increased expression of the usually repressed GATA1 targets (Figure 1F, Online Supplementary Table S2 and Online Supplementary Figure S1I-K). As expected, the 18S/28S ratio was diminished (Figure 1G). The quantity of ribosomes per cell was then assessed by label-free mass spectrometry (MS), which enabled an absolute quantification of RP by using histone signals as an internal calibrator.13,14 The quantity of RP of the small subunit 40S, expressed as fold-change (FC) in the copy number per cell, was decreased by 50% in the UT-7/EPO shRPS14 cells (Figure 1H) compared to the shSCR cells (Online Supplementary Table S1). By contrast, the quantity of RP of the large subunit 60S (RPL) was less impacted, thus confirming an unbalanced expression of RP. Consistently, an absolute quantification using O-propar- gyl-puromycin (OPP)-click-iT® revealed that translation had been globally decreased by half (Figure 1I). The polysome profiling of UT-7/EPO shRPS14 cell lines indi- cated a strong reduction or absence of the free 40S and a relative increase in the free 60S. The quantity of the entire 80S ribosome was reduced and the height of polysome peaks was lower, revealing that an RPS14 downregulation results in a decreased translating ribosome content (Figure 1J). We collected the sub-fractions corresponding to 40S, 60S, 80S, light and medium polysomes with 2-5 ribo- somes on an mRNA, and heavy polysomes that contain >5 ribosomes on an mRNA. Other than 40S, the sub-frac- tions were pooled as fraction I representing 60S and 80S, fraction II representing light and medium polysomes, and fraction III representing heavy polysomes (Figure 1J). We
then compared the abundance of GATA1 and MYC mRNA in each fraction. GATA1 mRNA was less abundant in the heavy polysomes of shRPS14 cells and had shifted to lighter fractions I and II (Figure 1K). This suggests that a majority of GATA1 transcripts carried a lower number of ribosomes. By contrast, the MYC mRNA profile did not vary between conditions in any of the fractions (Figure 1L). We also confirmed the decrease of GATA1 translation in K562 shRPS14 cell lines (Online Supplementary Figure S1L-Q). Taken together, these findings indicate that an RPS14 downregulation induces a decreased ribosome availability leading to selective translation at the expense ofGATA1.
Global assessment of translation under limited ribosome availability conditions
To address translation regulation as a whole in the UT- 7/EPO shRPS14 cells, we used Affymetrix HTA 2.0 microarrays to profile the mRNAs present on heavy polysomes referred to as the translatome (Figure 2A). We observed a weak correlation between the transcripts dif- ferentially expressed in the translatome and transcriptome of UT-7/EPO shRPS14 compared to UT-7/EPO shSCR cell lines (Figure 2B; Spearman test; r=0.286; P<0.0001; Online Supplementary Table S1). This weak correlation has already been reported in other translatome and transcriptome studies.12,18 The ratio of fold change FCtranslatome/FCtranscriptome enabled a determination of the transcripts with the largest translational efficiency variations (ΔTE) (Figure 2C). GATA1 mRNA was among the notable transcripts with a downregulated TE (Figure 2B and C). GSEA coupled to enrichment map visualization was then used to annotate the differentially enriched biological pathways of the translatome and transcriptome. Using a cytoscape repre- sentation (Figure 2D and Online Supplementary Table S3), we observed that the sets of genes less impacted by RP loss in the translatome were clustered into biological path- way annotations that included cell cycle and proliferation, DNA repair and apoptosis, and RNA processing and trans- lation. Conversely, the downregulated gene sets were poorly clustered. The few sets of genes less impacted by RP loss in the transcriptome were found to be involved in
ABC
C
D
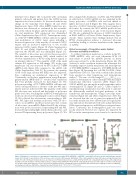
Figure 4. Validation of codon bias as a determinant of translation selectivity. K562 shRPS14640, shRPS14641 and shSCR cells were used in dual luciferase reporter assays. (A) Schematic representation of the luciferase codon contents. (B) Frequency distribution of the codon adaptation index (CAI) values among all human tran- scripts. The CAI of firefly and renilla luciferases are indicated. (C) Firefly/renilla luciferase activity in K562 shSCR cells comparing firefly luciferase with a high versus that with a low CAI. (D) Ratios of firefly/renilla luciferase activity in K562 shRPS14 to K562 shSCR comparing firefly luciferase with a high or low CAI (n=13). Medians are shown as white horizontal bars, boxes represent first and third quartiles, and whiskers represent minimal and maximal values. Light green denotes shRPS14640 and dark green indicates shRPS14641. Unpaired two-tailed Student t-test: **P<0.01; ****P<0.0001.
haematologica | 2021; 106(3)
751
