
Page 104 - 2021_03-Haematologica-web
P. 104
I. Boussaid et al.
A
B
C
D
F
EF
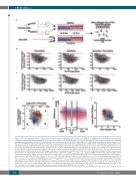
Figure 3. The codon adaptation index, coding sequence length and thermodynamic characteristics of the 3’UTR in an mRNA govern its translation selectivity under conditions of limited ribosome availability. (A) Schematic representation of the workflow: RNA from actively translating polysomes or whole cell lysates were analyzed using Affymetrix microarrays. The top 100 most expressed (in red) and less expressed (in blue) transcripts were identified by calculating the log2fold change (FC) of the values in shRPS14 compared to shSCR cell lines. The codon adaptation index (CAI) of the coding sequence (CDS) and the thermodynamic characteristics of the untranslated regions (UTR) including the fold energy, length, and energy per base were determined. Comparisons were made of the CDS and UTR characteristics of the top 100 less impacted and downregulated transcripts in the UT-7/EPO shRPS14 translatome and transcriptome. (B and C) Thermodynamic landscape: bi-para- metric scatter-plots are shown with the energy per base on the y axis and length on the x axis in a log scale of 5’UTRs (B) and 3’UTR (C). All transcripts described in the University of California Santa Cruz (UCSC) database are represented by gray dots. Red dots denote the top 100 less impacted transcripts and blue dots represent the top 100 more downregulated transcripts in the transcriptome, translatome and FCtranslatome/FCtranscriptome analysis. GATA1 is indicated by a green triangle. (D) Bi- parametric scatter-plot in a log scale representing the free-energy per base of the 3’UTR and length (CDS+UTR) of each transcript described in the UCSC database, represented as gray dots. Red dots denote the top 100 less impacted transcripts and blue dots indicate the top 100 more downregulated transcripts in FCtranslatome/FCtranscriptome analysis. (E) CROSS global score consensus prediction of the secondary structure profile of the top 100 less impacted (in red) and more down- regulated (in blue) impacted transcripts identified by FCtranslatome/FCtranscriptome analysis. Row scores are represented by the light color lines. Mean scores are denoted by the dark color lines. (F) For all human transcripts, the CAI and their respective transcript length (CDS+UTR) are represented as gray dots in a bi-parametric scat- ter-plot on a log scale. Red dots indicate the top 100 less impacted transcripts and blue dots denote the top 100 more downregulated transcripts in the FCtranslatome/FCtranscriptome analysis. P-values were calculated using a two-sided Mann-Whitney U-test.* P<0.05 ***P<0.001.
750
haematologica | 2021; 106(3)
