
Page 103 - 2021_03-Haematologica-web
P. 103
Erythroid mRNA translation in RPS14 deficiency
AB
C
D
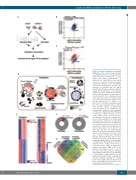
Figure 2. Selective translation in UT-7/EPO shRPS14 cell lines. (A) Schematic workflow showing RNA extraction from actively trans- lating polysomes (translatome) or from whole cell lysates (transcriptome) in shRPS14 640, shRPS14 641 and shSCR cells to be used for microarray analysis. Comparative analysis of the translatome related to the transcriptome and the deter- mination of transcripts with the largest translational efficiencies variation (∆TE) are shown. (B) 2D density plot of the log2(fold- change, FC) values obtained for the trans- latome and transcriptome. A Spearman test (r coefficient with 95% confidence interval and P-value) was used for correlation analy- sis. (C) Post-transcriptionally regulated com- ponents with an (FCtranslatome/FCtranscriptome) ratio >1.5 or <1/1.5 were overlaid as red or blue dots, respectively. (D) Gene set enrich- ment analysis (GSEA) of differentially expressed genes in the translatome and transcriptome. Enriched cellular programs are indicated using the Enrichment Map App of Cytoscape software (P-value cut-off = 0.005, q-value cut-off = 0.1). Nodes repre- sent the gene sets that were enriched at the top or bottom ranking of the differentially expressed genes. Node size corresponds to the number of genes in the set. Edges indi- cate overlaps between gene sets and the line thickness indicates the similarity coeffi- cient between gene sets in red for less impacted and blue for downregulated genes. The node color depends on the false discovery rate (FDR) value as shown on the scale. Clusters of nodes were determined with the Autoannotate App and are repre- sented by the circles. (E) Heatmaps repre- senting the significantly up- or downregulat- ed transcripts in the translatome and tran- scriptome with a P-value cut-off <0.05, a calculated q-value (FDR) in significance analysis microarrays (SAM) ≤0.05 and a minimum fold-change of >1.5 or <1/1.5. The color scale representing the minimum and maximum expression per row is indicat- ed. (F) Numbers of significantly up- or down- regulated transcripts shown as doughnuts. (G) Venn diagram showing the overlap between the significantly less impacted or more downregulated transcripts in the translatome and transcriptome.
EF
G
haematologica | 2021; 106(3)
749
