
Page 107 - 2021_03-Haematologica-web
P. 107
Erythroid mRNA translation in RPS14 deficiency
ABCDE
FGH
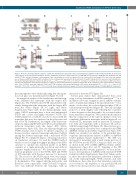
Figure 6. Proteome and transcriptome analyses confirm the identified rules and point to the post-translational regulation of ribosomal protein (RP). (A) Schematic representation of the experimental workflow: absolute quantitative proteomics analysis (label free LC-MS/MS) was performed in shRPS14 640, shRPS14 641 and shSCR UT7/EPO cell lines leading to a determination of the copy number per cell of each protein. Data are expressed as fold-change (FC) of the mean copy number per cell between shRPS14 versus shSCR conditions for three independent experiments. (B) Scatter plots of log2(FC) obtained for the proteome and transcriptome. Post-transcriptionally regulated components with an ( FCproteome/FCtranscriptome) ratio >1.5 or <1/1.5 were overlaid as red or blue dots, respectively. (C) ∆TE values deter- mined in the translatome/transcriptome analysis (see Figure 2) of post-transcriptionally regulated components. (D-G) Comparison of the thermodynamic character- istics of the 3’UTR (D), transcript length (E), CAI (F) and 5’UTR (G) between the two groups defined in (B) and the group with an (FCproteome/FCtranscriptome) ratio <1/1.5 minus RP. **P<0.001; ***P<0.001; ****P<0.0001. (H) Gene Ontology enrichment analysis of the most post-transcriptionally up- or downregulated components.
the transcriptome were similar indicating that the regula- tion took place at a translational level (Figure 3C, left).
An integrated analysis of the translatome and transcrip- tome identified the transcripts with the largest ΔTE (Figure 2C). The 3’UTR but not 5’UTR characteristics effi- ciently distinguished the transcripts with the largest ΔTE from the others (Figure 3B, 3C right, and Online Supplementary Figure S3E). In the thermodynamic land- scape, GATA1 transcripts have a short and unstructured 5’UTR and a short and highly structured 3’UTR. The 3’UTR parameters of GATA1 caused it to cluster with the transcripts that were less expressed on the polysomes and had a low TE. Furthermore, the length of the entire tran- script encompassing the UTR and CDS was discriminative between transcripts with the largest ΔTE (Online Supplementary Figure S3E). Thus, the transcript length and 3’UTR structure were found to be effective separators of the most and less expressed transcripts and placed GATA1 among the shortest transcripts with a structured 3’UTR (Figure 3D). To confirm the impact of transcript structures on translation outcomes, we used the CROSS method which is based on high-throughput profiling of the RNA structure to calculate the structural profile of an RNA sequence at a single-nucleotide resolution and without sequence length restrictions.24 We determined the struc- turation propensity score of the 5’UTR, CDS and 3’UTR of 100 transcripts with the most increased or decreased TE. The scores for the 5’UTR region were very similar, whereas those for the CDS and 3’UTR regions were high- ly discriminative. This suggests that the nucleotides, and therefore codon composition, of the CDS and 3’ sequence were very different between the transcripts with an
increased or decreased TE (Figure 3E).
Several prior studies have demonstrated that codon
usage is a key determinant of mRNA translation20,25-27 as it modulates ribosome elongation speed, mRNA stability, and co-translational folding of the nascent protein.28-31 As a metric of codon bias, the codon adaptation index (CAI) of each transcript was plotted (Figure 3F). The CAI can range from 0 to 1, with a higher value reflecting the occurrence of more frequent codons that tend to be associated with a faster translation elongation.16 We found from this analysis that the composition of the CDS in optimal codons was completely different in transcripts with an increased or a decreased TE, transcripts with an increased TE having a low CAI, and transcripts with a decreased TE such as GATA1 having a high CAI (Figure 3F). These features gov- erning translation selectivity were confirmed in the K562 shRPS14 cell line model (Online Supplementary Figure S3F). Finally, we extended our analysis to the published tran- scriptome and translatome datasets of shRPL5 or shRPS19 treated primary human erythroblasts.12 The ΔTE was increased for transcripts with a weak energy per base of the 3’UTR but not the 5’UTR, a long size and a low CAI, as shown in the UT-7 or K562 shRPS14 cell lines (Online Supplementary Figure S3G and H). Targeting of the 40S rather than the 60S subunits appeared to be more delete- rious to the translation of mRNAs with structured 5’UTR translation (Online Supplementary Figure S3I). Taken togeth- er, these data show that translation selectivity is depend- ent on the transcript length, 3’UTR structure, and CAI. Furthermore, these data show that translation selectivity is not related to the depletion of one particular RP, but rather to the decrease in ribosome cellular content.
haematologica | 2021; 106(3)
753
