
Page 155 - 2021_02-Haematologica-web
P. 155
Hemoglobin switching in Klf1wt/Nan mice
AB
CD
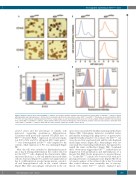
Figure 4. Analysis of blood from control and Klf1wt/Nan embryos. (A) Cytospins of E14.5 and E16.5 blood isolated from control (Klf1wt/wt) and Klf1wt/Nan embryos, stained with dianisidine and histological dyes.32 (B) Fraction of nucleated cells in blood isolated from control ( Klf1wt/wt) and Klf1wt/Nan littermates at early, mid and late E14.5. *P<0.05; error bars indicate standard deviations. N=3 for each genotype at each developmental time point. (C) Cell size analysis of E14.5 and E16.5 blood isolated from control (Klf1wt/wt) and Klf1wt/Nan embryos, obtained with a CASY cell counter. (D) Histograms of flow cytometry analysis of blood isolated at E10.5 and E14.5 from control (Klf1wt/wt) and Klf1wt/Nan embryos. Arrow indicates CD9+ primitive erythrocytes in Klf1wt/wt E14.5 blood.
slowed down and the percentage of smaller cells increased, suggesting spontaneous differentiation. Consistent with previously reported RT-qPCR data of Klf1wt/Nan fetal liver RNA,24 expression of cell cycle regula- tors E2F2, E2F4, and P18, all known KLF1 target genes,11 37,38 was downregulated in Klf1wt/Nan cells compared to the controls, while expression of P21 was unchanged (Figure 5B).
Next, the cells were switched to differentiation medi- um at day 6. During differentiation the control cells, but not the Klf1wt/Nan cells, displayed the characteristic differ- enti-ation divisions, i.e., the cell number increased while cell size decreased (Figure 5 C and D). Cytospins taken at day 2 of differentiation revealed many mature, enucleat- ed and hemoglobinised cells in the control cultures (Figure 5Ea). Rare macrophages still present in the cul-
tures were surrounded by healthy maturing erythroblasts (Figure 5Eb). Macrophage inclusions resembled nuclei, presumably resulting from phagocytosis of pyrenocytes (expelled erythroid nuclei33). In contrast, the Klf1wt/Nan cul- tures showed few enucleated cells and the cells displayed much larger nuclei (Figure 5Ec). Macrophages were not surrounded by enucleating erythroblasts, but appeared to engulf the entire erythroblast (Figure 5Ed). Combined these observations suggest that Klf1wt/Nan erythroblasts are impaired in both proliferation and differentiation. It is known that KLF1 blocks progression to myeloid lineag- es.39 In the Klf1wt/Nan cultures we observed cells with mor- phological features of megakaryocytes (Figure 5Ee). Flow cytometry analysis of the cultured cells at day 9 revealed that control cultures were essentially free of non-ery- throid cells, while Klf1wt/Nan cultures displayed pan-
haematologica | 2021; 106(2)
469
