
Page 153 - 2020_09-Haematologica-web
P. 153
Clinical determinants of thrombin generation
Considering the strong positive association between TG and the use of oral contraceptives or hormone replace- ment therapy, individuals taking these medications were excluded from Cox regression analysis. In the first model, adjustments were made for age, sex, and vitamin K antag- onist use, whereas in the second and third models, addi- tional adjustments were made for CVRF and CVD, respec- tively. As demonstrated by the second model in Table 4A, B, Cox regression analysis confirmed an increased mortal- ity for individuals with a lag time at 1 pM TF above the 95th percentile of the reference [hazard ratio (HR) = 1.55, 95% confidence interval (95% CI): 1.14-2.11; P=0.0058] and with ETP at 5 pM TF above the 95th percentile of the reference (HR=1.53, 95% CI: 1.09-2.15; P=0.015), inde- pendently of the presence of CVRF. After additional adjustment for CVD, lag time at 1 pM TF (HR=1.46, 95% CI: 1.07-2.00; P=0.018) and ETP at 5 pM TF (HR=1.50, 95% CI: 1.06-2.13; P=0.023) remained associated with mortality.
Discussion
The formation of thrombin is one of the key processes underlying thrombotic diseases and its role in CVD due to atherosclerosis attracted new interest with recent data showing superior efficacy of a combined strategy of aspirin and low-dose direct oral anticoagulation in reduc- ing atherothrombotic events.17 Hence, limiting TG by inhibiting factor Xa provides an interesting approach to lower cardiovascular risk. In this study we explore the clinical determinants of TG measured in plasma, in a large population-derived study. Our data provide important
insights into the effects of CVRF in males and females. This study is the first to demonstrate the positive associa- tion of TG parameters, ETP as a global measure of proco- agulant and anticoagulant action in plasma and lag time, with total mortality, independent of age, sex and CVRF.
The presented reference values may be generalized to other laboratories. However, the reference ranges should be used with caution as the (pre-)analytical conditions of the assay may influence the reference ranges and stan- dardization between laboratories is needed, as well as confirmation of the observed data. The reference values of the TG parameters as well as the mean and median values of the TG parameters in the overall study sample showed sex-specific differences with females having shorter lag times and higher ETP and peak height, compared to males. The sex differences in TG can be partly explained by the strong influence of female endogenous sex hor- mones on the coagulation cascade, as higher levels of fib- rinogen and lower levels of protein S, antithrombin and protein C were observed in females, compared to males, irrespective of hormonal treatment.18
Following a sex-stratified, fully adjusted, large, multi- variable model analysis we show that age, obesity and dyslipidemia are the most important clinical factors linked with higher TG potential. Furthermore, this study demon- strates the effect of different groups of medication on TG, with hormone-containing drugs being positively associat- ed and anticoagulant and antiarrhythmic drugs being inversely associated with TG potential.
Few studies have described the effect of age on TG parameters.10,11,19 Collectively, these studies suggest that TG potential enhances with increasing age, indicated by shorter lag time and higher ETP and peak height.
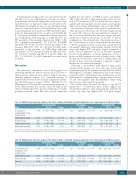
Table 3A. Multiple linear regression analysis of the effects of drugs on thrombin generation parameters in the study sample at 1 pM tissue factor.
β
-0.0795
0.0862 0.112 0.114 0.0552
Log (lag time [min]) 95% CI
(-0.0979; -0.0611)
(0.0661; 0.106) (0.0763; 0.147) (0.0537; 0.174) (0.0248; 0.0856)
β
151
-92.8 -83.3 -28.6 0.270
ETP (nM.min) 95% CI
(124; 178)
(-122; -63.4) (-135; -31.5) (-116; 59.0) (-44.1; 44.6)
β 95% CI 35.1 (29.7; 40.4)
Peak height (nM)
Drug
Sex hormones
and modulators of the genital system
Antithrombotic agents Cardiac therapy Immunosuppressants Anti-gout preparations
P-value <0.000001
<0.000001 <0.000001 0.00021 0.00038
P-value <0.000001
<0.000001 0.0016 0.52 0.99
P-value <0.000001
-5.01 (-11.0; 0.952) 0.10 -3.94 (-14.4; 6.54) 0.46 -1.37 (-19.1; 16.3) 0.88 3.76 (-5.20; 12.7) 0.41
The analysis was adjusted for age, sex, cardiovascular risk factors and cardiovascular diseases. Bonferroni corrected P-value (0.00079) is used. For categorization of medication groups see Online Supplementary Material Part A. ETP: endogenous thrombin potential; 95% CI: 95% confidence interval.
Table 3B. Multiple linear regression analysis of the effects of drugs on thrombin generation parameters in the study sample at 5 pM tissue factor.
β
-0.0558
0.0656
0.0916
0.0354
Log (lag time [min]) 95% CI
(-0.0706; -0.0411)
(0.0495; 0.0817)
(0.0633; 0.120)
(0.0157; 0.0522)
ETP (nM.min) β 95% CI
120 (93.6; 147)
-122 (-151; -93.4)
-122 (-173; -71.1)
-37.0 (-72.5; -1.45)
β
44.9
-19.4
-16.0
-4.55
Peak height (nM)
Drug
Sex hormones and modulators of the genital system
Antithrombotic agents
Cardiac therapy
Diuretics
P-value <0.000001
<0.000001
<0.000001
0.00043
P-value <0.000001
<0.000001
0.0000028
0.041
95% CI
(38.7; 51.1)
(-26.3; -12.6)
(-28.0; -3.89)
(-12.9; 3.84)
P-value <0.000001
<0.000001
0.0096
0.29
The analysis was adjusted for age, sex, cardiovascular risk factors and cardiovascular diseases. Bonferroni corrected P-value (0.00079) is used. For categorization of medication groups see Online Supplementary Material Part A. ETP: endogenous thrombin potential; 95% CI: 95% confidence interval.
haematologica | 2020; 105(9)
2331
