
Page 152 - 2020_09-Haematologica-web
P. 152
P.C.S. van Paridon et al.
Kaplan-Meier survival curves and Cox-regression models
During the follow-up period until April 2017, with a median follow-up of 9.21 (8.83-9.65) years, a total of 308 deaths were registered. As presented in Figure 1, a longer lag time above the 90th percentile of the reference, at both 1 pM TF (Figure 1A) and 5 pM TF (Figure 1B), was signif-
icantly associated with worse survival (P<0.0001). In addi- tion, higher ETP above the 90th percentile (P=0.034) and 97.5th percentile (P=0.00097) of the reference sample (Figure 1C), measured at 5 pM TF was associated with worse survival. No such associations were observed for ETPat1pMTF.
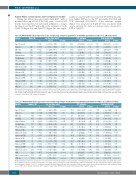
Table 2A. Multivariable linear regression in the overall study sample for parameters of thrombin generation in males at 1 pM tissue factor.
Variable
Age (10 years)
Diabetes Obesity
Smoking Hypertension Dyslipidemia
FH of MI/stroke History of MI History of stroke History of CAD History of AF History of PAD History of VTE History of CHF History of cancer
VKA use
Males (N)
242 628 515 1,395 917 853 116 57 167 93 107 71 39 194
391
β
0.0098
-0.0318 0.0392 0.0151 0.0135 0.0428 -0.00624 0.0263 0.0352 -0.0306 0.0418 0.0367 -0.0342 -0.00240 -0.000508
0.646
Log (lag time [min]) 95% CI
(0.00199;0.0175)
(-0.0593;-0.00441) (0.0214;0.0570) (-0.00328;0.0334) (-0.00263;0.0297) (0.0275;0.0580) (-0.0217;0.00919) (-0.0193;0.0719) (-0.0169;0.0874) (-0.0674;0.00617) (-0.00183;0.0854) (-0.00267;0.0761) (-0.0794;0.0111) (-0.0652;0.0604) (-0.0284;0.0273)
(0.0589;0.702)
P-value 0.014
0.023 <0.0001 0.11 0.10 <0.0001 0.43 0.26 0.19 0.10 0.061 0.068 0.14 0.94
β
28.9
-6.00 54.7 18.2 -6.70 30.6 17.1 -57.5 -39.7 25.7 -19.5 -53.0 -4.91 -15.1
ETP (nM.min)
95% CI P-value
(17.9;39.9) <0.0001
(-45.0;33.0) 0.76 (29.5;80.0) <0.0001
(-7.82;44.3) 0.17 (29.7;16.3) 0.57 (8.96;52.3) 0.0057 (-4.84;39.0) 0.13 (-122;7.32) 0.082 (-114;34.4) 0.29 (-26.6;77.9) 0.34 (-81.4;42.4) 0.54 (-109;2.95) 0.064 (-69.2;59.4) 0.88 (-104;74.0) 0.74 (-38.8;40.3) 0.97
β
7.60
5.16
7.83
-1.64
-3.22
1.39
-0.283
-8.36
-2.67
1.21
-6.31
-10.6
-1.44
5.46
-2.11
-66.3
Peak height (nM)
95% CI P-value
(5.23;9.97) <0.0001
(-3.21;13.5) 0.23
(2.40;13.3) (7.24;3.96) 0.57
(-8.15;1.72) 0.20 (-3.27;6.04) 0.56 (-4.99;4.42) 0.91 (-22.3;5.56) 0.24 (-18.6;13.2) 0.74 (-10.0;12.4) 0.83 (-19.6;6.99) 0.35
0.0048
(-22.6;1.40) (-15.3;12.4) 0.84 (-13.7;24.6) 0.58 (-10.6;6.39) 0.63
(-83.5;-49.2) <0.0001
0.083
0.11 0.764
<0.0001 -716 (-796;-637) <0.0001
Multivariable linear regression models were calculated in the overall study sample for each parameter of thrombin generation as a dependent variable separately.The analysis was adjusted for age,vitamin K antagonist use,presence of cardiovascular risk factors and cardiovascular diseases. ETP:endogenous thrombin potential;95% CI:95% confidence interval;FH:family history;MI:myocardial infarction;CAD:coronary artery disease;AF:atrial fibrillation;PAD:peripheral artery disease;VTE:venous thromboembolism;CHF: congestive heart failure;VKA: vitamin K antagonist.
Table 2B. Multivariable linear regression in the overall study sample for parameters of thrombin generation in females at 1 pM tissue factor.
Variable
Age (10 years)
Diabetes Obesity
Smoking Hypertension Dyslipidemia
FH of MI/stroke History of MI History of stroke History of CAD History of AF History of PAD History of VTE History of CHF History of cancer HRT
Oral contraceptives
VKA use
Log (lag time [min]) β 95%CI
β 95%CI P-value β 95%CI
Females (N)
ETP (nM.min) Peak height (nM)
123 542 415 1,092 517 924 35 35 50 35 93 124 36 236 223 151
292
0.0410
-0.00149 0.0587 0.0222 0.0214 0.0429 -0.0089 -0.0273 -0.0826 0.0336 -0.0320 0.0390 -0.0348 -0.0588 0.00886 -0.0457 -0.145
0.816
(0.0332;0.0488)
(-0.0342;0.0312) (0.0411;0.0763) (0.00372;0.0408) (0.00582;0.0370) (0.0254;0.0604) (-0.0233;0.00546) (-0.099;0.0445) (-0.149;-0.0159) (-0.0178;0.0850) (-0.106;0.0417) (0.00303;0.0749) (-0.0687;-0.000971) (-0.13;0.0122) (-0.015;0.0327) (-0.0669;-0.0246) (-0.175;-0.116)
(0.743;0.889)
P-value <0.0001
0.93 <0.0001 0.019 0.0072 <0.0001 0.22 0.46 0.015 0.20 0.39 0.034 0.044 0.10 0.47 <0.0001 <0.0001
<0.0001
-15.5
-34.2 110 -17.3 -14.7 24.5 5.08 -19.2 105 -46.4 104 -25.1 44.4 -3.77 -33.6 60.1 379
-751
(-28.0;-2.99)
(86.8;18.3) (81.9;139) (-47.1;12.4) (-39.8;10.4) (-3.63;52.6) (-18.0;28.1) (-135;96.2) (-2.54;212) (-129;36.1) (-14.8;222) (-82.9;32.6) (-10.0;98.8) (-118;110) (-71.9;4.75) (26.2;94.1) (331;427)
(-869;-633)
0.015 0.657
0.20 2.24 <0.0001 11.7 0.25 -7.23
0.25 -4.76 0.088 -2.02 0.67 1.50 0.74 8.04 0.056 21.2 0.27 3.34 0.086 20.3 0.39 -3.96 0.11 1.70 0.95 -9.50 0.086 -3.68
0.00053 14.3
<0.0001 91.1
<0.0001 -92.1
P-value (-1.90;3.22) 0.62
(-8.54;13.0) 0.68
(5.86;17.5) (-13.3;-1.12) (-9.90;0.390)
<0.0001 0.020 0.070
(-7.80;3.75) 0.49 (-3.24;6.23) 0.54 (-15.6;31.7) 0.51
(-0.799;43.2) (-13.6;20.3) 0.70 (-3.95;44.6) 0.10 (-15.8;7.89) 0.51 (-9.47;12.9) 0.77
(32.9;13.9) 0.43 (-11.5;4.19) 0.36
0.059
(7.28;21.2)
(81.3;101)
(-116;-67.9)
<0.0001
<0.0001
<0.0001
Multivariable linear regression models were calculated in the overall study sample for each parameter of thrombin generation as a dependent variable separately. The analysis was adjusted for age,use of vitamin K antagonists,oral contraceptives,and hormone replacement therapy, cardiovascular risk factors and cardiovascular diseases. ETP:endoge- nous thrombin potential; 95% CI: 95% confidence interval; FH: family history; MI: myocardial infarction; CAD: coronary artery disease; AF: atrial fibrillation; PAD: peripheral artery disease;VTE: venous thromboembolism; CHF: congestive heart failure; HRT: hormone replacement therapy;VKA: vitamin K antagonist.
2330
haematologica | 2020; 105(9)
