
Page 151 - 2020_09-Haematologica-web
P. 151
Clinical determinants of thrombin generation
Data management and statistical analysis are described in
Online Supplementary Material, Part A.
Results
Study sample and reference subsample characteristics
While there was a balanced sex ratio in the overall study sample, there was a slight preponderance of women (55.3%) in the reference subsample. The median and interquartile range (IQR) of age of the study sample was 56 years (IQR, 46-66) in males and 55 years (IQR, 45-64) in females. The reference sample included 1,210 subjects, of whom 541 (44.7%) were male and 669 (55.3%) female. The median age of the reference sample was 47 years (IQR, 42-55) in males and 48 years (IQR, 41-54) in females. In the study population, hypertension was the most prevalent CVRF, being present in 56.6% of the male pop- ulation and 46.1% of the female population, followed by dyslipidemia. Antithrombotic agents were taken by 15.9% of males and 9.4% of females. Among females, 6.4% were taking oral contraceptives and 12.3% hormone replacement therapy. Detailed characteristics of the study population and reference sample are presented in Online Supplementary Table S1.
Thrombin generation reference values and parameters in the overall study sample
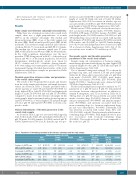
The results of the TG parameters in males and females from the study sample and reference subsample (reference values) are shown in Table 1. Females presented with a shorter lag time at 1 pM TF and 5 pM TF (P<0.0001 for both), higher ETP at 1 pM TF (P<0.0001) and higher peak height at 1 pM TF (P=0.014) and at 5 pM TF (P<0.0001) compared to males from the reference subsample. In the study sample, females presented with a shorter lag time at 1 pM TF (P<0.0001), as well as higher ETP and peak height at both 1 pM TF and 5 pM TF (P<0.0001 for both), com- pared to males.
Clinical determinants of thrombin generation in the overall study sample
As shown in Table 2, age was associated with longer lag time, both in males (Table 2A) and females (Table 2B), at 1 pM TF (males: P=0.014; females: P<0.0001) and at 5 pM TF (Online Supplementary Table S2A, B). In males, age was pos-
itively associated with ETP at 1 pM TF (Table 2A) and peak height at 1 pM TF (Table 2A) and at 5 pM TF (Online Supplementary Table S2A). In contrast, in females, age was associated with lower ETP at 1 pM TF (P=0.015) and lower peak height at 5 pM TF (Online Supplementary Table S2B).
Of the various CVRF considered, obesity showed a pos- itive association with lag time (males: P<0.0001; females: P<0.0001), ETP (males: P<0.0001; females: P<0.0001 ) and peak height (males: P=0.0048; females: P<0.0001) at 1 pM TF. Dyslipidemia was positively associated with lag time in both males (P<0.0001) and females (P<0.0001) and with ETP in males only (P=0.0057) at 1 pM TF. Similar findings for both obesity and dyslipidemia were observed at 5 pM TF as shown in Online Supplementary Table S2A, B. No associations were found for TG and history of CVD.
Therapeutic agents and thrombin generation parameters in the overall study sample
Females using oral contraceptives or hormone replace- ment therapy presented with shorter lag time, higher ETP and peak height at both 1 pM TF (Table 2B) and 5 pM TF (Online Supplementary Table S2B).
Use of vitamin K antagonists reduced TG as shown by prolonged lag time, and reduced ETP and peak height (Table 2A, B). These effects were detectable at 1 pM TF in both males (P<0.0001; ETP: P<0.0001; peak height: P<0.0001) and females (P<0.0001; ETP: P<0.0001; peak height: P<0.0001;). Similar results were obtained at 5 pM TF (Online Supplementary Table S2A, B).
Results from multiple linear regression analysis for TG parameters at 1 pM TF and at 5 pM TF, demonstrated associations between other medications, in addition to vitamin K antagonists, and TG as shown in Table 3A, B. The lag time at 1 pM TF was positively associated with intake of cardiac drugs (P<0.0001), diuretics (P=0.00043), anti-gout preparations (P=0.00038) and immunosuppres- sants (P=0.00021), and inversely associated with hor- mone-containing drugs (i.e., hormone replacement thera- py and oral contraceptives, P<0.0001). Differently, ETP was inversely associated with cardiac drugs, ATC code C01 (P<0.0001) at 5 pM TF and positively with hormone- containing drugs (P<0.0001). Peak height showed a posi- tive association with hormone-containing drugs (P<0.0001). The results at 5 pM TF were comparable to the results at 1 pM TF.
Table 1. Parameters of thrombin generation in the reference subsample and the study sample.
Lag time (1 pM TF), min
ETP (1 pM TF), nM.min Peak height (1 pM TF), nM Lag time (5 pM TF), min ETP (5 pM TF), nM.min
Peak height (5 pM TF), nM
5.07 (4.67;5.67)
1047 (216)
108 (51)
2.67 (2.33;3.00)
1322 (196) 236 (52.2)
4.67 (4.33;5.33) <0.0001
1099 (203) <0.0001 115 (48.7) 0.014 2.39 (2.33;2.67) <0.0001
1318 (212) 0.71 259 (53.3) <0.0001
Male Females (n=2,471) without OC (n=2,218)
5.33 (4.74;6.07) 5 (4.40;5.67)
1068 (267) 1115 260 113 (51.9) 117 51
2.67* (2.40;3.00) 2.67* (2.33;3.00) 1352 (267) 1370 (266)
238 (59.3) 257 (61)
Females with OC (n=151)
4 (3.40;4.33)
1491 (308)
201 (63)
2.06 (2;2.33)
1661 (350)
365 (71)
P-value
<0.0001
<0.0001
<0.0001
<0.0001
<0.0001
<0.0001
Reference subsample (N=1,210)
Male Female P-value
(n=541) (n=669)
Study sample (N=4,843)
The values presented are thrombin generation parameters at 1 pM and 5 pM tissue factor in the reference subsample and study sample. Medians (interquartile range) of lag time and means (standard deviation) of endogenous thrombin potential and peak height are presented. *Due to equal times, the median values in males and females are the same; however, the distribution of the lag time values is different in males and females. TF: tissue factor; ETP: endogenous thrombin potential.
haematologica | 2020; 105(9)
2329
