
Page 154 - 2020_09-Haematologica-web
P. 154
P.C.S. van Paridon et al.
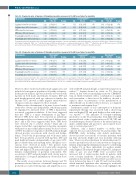
Table 4A. Prognostic value of markers of thrombin generation, measured at 1 pM tissue factor, for mortality.
TG parameter
Lag time below 5% of reference
Lag time above 95% of reference ETP below 5% of reference
ETP above 95% of reference
Peak height below 5% of reference
Peak height above 95% of reference
First model* HR 95% CI
1.22 (0.58; 2.60)
1.54 (1.14; 2.08) 1.08 (0.75; 1.56) 1.41 (0.98; 2.03) 1.14 (0.78; 1.67)
1.28 (0.82; 2.01)
P-value HR 0.60 1.11
0.0055 1.55
0.66 1.11
0.061 1.44
0.51 1.18
0.27 1.29
Second model**
95% CI P-value
(0.52; 2.37) 0.78
(1.14; 2.11) 0.0058
(0.77; 1.60) 0.58
(0.99; 2.07) 0.051
(0.81; 1.74) 0.39
(0.83; 2.03) 0.26
Third model*** HR 95% CI
P-value 1.14 (0.53; 2.42) 0.74
1.46 (1.07; 2.00)
1.05 (0.72; 1.52) 0.80
0.018
1.41 (0.97; 2.04)
0.071
1.12 (0.76; 1.65) 0.56
1.39 (0.89; 2.18) 0.15
Cox regression model performed in the overall study sample with mortality as outcome and markers of thrombin generation as predictors. Models were *adjusted for age, sex and vitamin K antagonist (VKA) use. **adjusted for age, sex,VKA use and presence of cardiovascular risk factors (CVRF). ***adjusted for age, sex,VKA, use, presence of CVRF, and cardiovascular disease.TG: thrombin generation; HR: hazard ratio; 95% CI: 95% confidence interval; ETP: endogenous thrombin potential.
Table 4B. Prognostic value of markers of thrombin generation, measured at 5 pM tissue factor, for mortality.
TG parameter
Lag time below 5% of reference
Lag time above 95% of reference ETP below 5% of reference
ETP above 95% of reference
Peak height below 5% of reference Peak height above 95% of reference
First model* HR 95% CI
1.08 (0.40; 2.90)
1.29 (0.92; 1.79) 1.35 (0.94; 1.94) 1.55 (1.11; 2.17) 1.07 (0.72; 1.59) 1.18 (0.78; 1.78)
Second model** 95% CI
(0.36; 2.63)
(0.89; 1.75) (0.94; 1.97) (1.09; 2.15) (0.73; 1.63) (0.80; 1.83)
Third model***
P-value HR 0.89 0.98
0.14 1.25
0.11 1.36 0.0099 1.53 0.76 1.09 0.44 1.21
P-value HR 0.96 1.08
0.20 1.17 0.10 1.26 0.015 1.50 0.66 1.02 0.37 1.23
P-value (0.40; 2.92) 0.88
(0.83; 1.65) 0.36 (0.87; 1.83) 0.23
95% CI
(1.06; 2.13)
(0.68; 1.52) 0.92 (0.81; 1.86) 0.34
0.023
Cox regression model performed in the overall study sample with mortality as outcome and markers of thrombin generation as predictors. Models were *adjusted for age, sex and vitamin K antagonist (VKA) use. **adjusted for age, sex,VKA use and presence of cardiovascular risk factors (CVRF). ***adjusted for age, sex,VKA, use, presence of CVRF, and cardiovascular disease.TG: thrombin generation; HR: hazard ratio; 95% CI: 95% confidence interval; ETP: endogenous thrombin potential.
However, these studies had rather small sample sizes and included a homogenous population of healthy volunteers. In the present analysis, age was positively associated with lag time in both males and females. In males, ETP and peak height increased with age, whereas in females the amount of TG showed a rather negative trend with less strong associations compared to those in males.
Other positive determinants of lag time observed in this study were obesity and dyslipidemia, which may partly be explained by increased levels of TFPI, a lipoprotein- associated coagulation inhibitor. It has been suggested that free TFPI is a major determinant of lag time.10 Elevated TFPI levels have been reported in individuals with impaired glucose tolerance and type 2 diabetes mel- litus20 and it has been suggested that these TFPI levels were elevated due to related obesity.21 Smid and col- leagues found that a prolongation in lag time in patients with previous myocardial infarction may be due to release of TFPI.7 In addition to lag time, both ETP and peak height showed positive associations with obesity and dyslipi- demia. Total body fat percentage and body mass index have been positively associated with lag time, ETP and peak height in females, independently of age, prior CVD, glucose metabolism and smoking status, though no asso- ciations were observed in males.22 The present study demonstrates strong relations of obesity with a longer lag time and higher ETP and peak height in both males and females, independently of potential confounders. The association of ETP and peak height with obesity may be attributed to a low-grade inflammation observed in obese individuals.23
The results on associations between therapy and TG parameters showed that use of vitamin K antagonists was positively associated with lag time and negatively associ-
ated with ETP and peak height, as expected from previous studies.24-26 Aspirin showed no effect on TG (data not shown), in line with recent findings from the COMPASS trial, in which treatment with a combination of aspirin and rivaroxaban, a direct factor Xa inhibitor, showed a superior effect on prevention of the manifestation of atherothrombosis in atherosclerotic disease, as compared to treatment with aspirin alone.17
Furthermore, intake of oral contraceptives or hormone replacement therapy was associated with a shorter lag time and higher ETP and peak height, in line with previ- ous reports.10,27-29 The influence of estrogen-containing medication on the TG potential has been linked through increased levels of the coagulation factors II, VII, VIII, and X and fibrinogen, decreased levels of the natural anticoag- ulants, antithrombin and protein S, and acquired resist- ance to activated protein C.27,28
Hitherto, only a limited number of studies have explored the association between TG and mortality. The PROSPER study, including only elderly individuals, showed positive associations of vascular mortality with lag time and peak height and total mortality with lag time.5 However, after adjustment for interleukin-6 and C- reactive protein levels, the associations were no longer sig- nificant, indicating that inflammation may be contributing to higher TG in these individuals. In another smaller study, higher ETP and peak height (at 5 pM TF), independ- ently of age, sex and CVRF, were associated with increased risk of cardiovascular death in patients with acute coronary syndrome.30 In the present large, adult, population-based study, we demonstrate a positive associ- ation between lag time at 1 pM TF and total mortality, which remained significant after adjusting for traditional CVRF and CVD. Furthermore, this study highlights the
2332
haematologica | 2020; 105(9)
