
Page 103 - 2020_09-Haematologica-web
P. 103
SETDB1 expression suppresses MLL-fusion driven AML
Supplementary Figure S7B). Repetitive elements may con- sume H3K9me3 sequencing depth making it difficult to map with stringency. We circumvented this by performing ChIP-Seq for H3K9ac, which is mutually exclusive of H3K9me3 and associated with gene activation, in contrast to H3K9me3.38 We performed H3K9ac ChIP-seq on MLL- AF9 and MLL-AF9+SETDB1 cells and saw changes at over 6,000 promoter regions, including both increased and decreased H3K9ac signal (Online Supplementary Figure S7C and Online Supplementary Table S5). Gene ontology analy-
sis reveals that genes with decreased promoter H3K9ac in MLL-AF9+SETDB1 cells were associated with cell cycle and RNA binding, whereas genes with increased promot- er H3K9ac were associated with signaling pathways and negative regulation of proliferation (Figure 6B). Overlapping downregulated genes with genes that exhibit reduced promoter ATAC-seq and H3K9ac ChIP-seq signal in MLL-AF9+SETDB1 cells and scoring by their combined fold changes reveals several interesting targets including Six1 and Mefv, which are implicated as biomarkers in
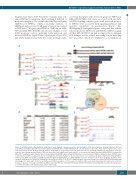
Figure 6. SETDB1 regulates the epigenetic landscape of acute myeloid leukemia oncogenes and biomarkers. (A) Sequencing tracks showing H3K9me3 ChIP-seq (top), ATAC-seq (middle), and RNA-seq (bottom) signals for MA9+EV (blue) or MA9+SETDB1 (red) cells. Shown here is the entire Hoxa cluster of genes and a closer view of Hoxa9 specifically. (B) Gene ontology analysis using DAVID to query biological process, molecular function, and Kegg pathway gene sets that are overrepre- sented in the following groups: H3K9ac ChIP-seq peaks that have significantly reduced (blue) or increased (red) signal intensity in MA9+SETDB1 compared to MA9+EV. (C) Overlap analysis of genes that are downregulated by SETDB1, genes where SETDB1 drives reduced promoter H3K9ac, and genes where SETDB1 drives reduced promoter ATAC-seq signal. (D) Top ten scoring genes when fold changes for the three datasets in C are summed. (E) Sequencing tracks showing H3K9ac ChIP-seq (top), ATAC-seq (middle), and RNA-seq (bottom) signals for MA9+EV (blue) or MA9+SETDB1 (red) cells. Shown here is the locus for Dock1. Statistics: differ- entially bound regions are defined by DiffBind false discovery rate (FDR) <0.05 (B/C/D); Significant gene expression changes are defined by DESeq2 algorithm with fold change >1.5 and padj<0.05 (C). For all ChIP-seq and ATAC-seq studies, n = 2 for each cell condition. AML: acute myeloid leukemia; EV: empty vector control; n: biological replicates; *: P/padj<0.05; RNA-seq: RNA sequencing; ChIP-seq: chromatin immunoprecipitation followed by sequencing; ATAC-seq: assay for transposase- accessible chromatin coupled with next-generation sequencing.
haematologica | 2020; 105(9)
2281
AB
D
E
C
