
Page 104 - 2020_09-Haematologica-web
P. 104
J. Ropa et al.
AML patients39,40 (Figure 6C-D and Online Supplementary Table S5). We also observed significant loss of promoter H3K9ac and chromatin accessibility and reduced gene expression of Dock1 (Figure 6E), which is a prognostic marker of AML that displays changes in DNA methyla- tion in AML patient samples relative to normal HSPC.41,42 We identified several direct binding targets of MLL-AF9 that underwent epigenetic remodeling and expression
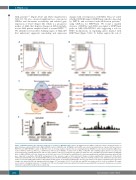
changes with overexpression of SETDB1. Thus, we asked whether SETDB1 impacts H3K79me2, which is deposited by DOT1L and associated with MLL-fusion proteins,36 using ChIP-seq for H3K79me2. We found a marked decrease of H3K9ac and ATAC-seq signal at H3K79me2 peaks in MLL-AF9+SETDB1 cells suggesting a role for H3K9 modifications in regulating genes marked with H3K79me2 (Figure 7A-B). To further explore the role of
Figure 7. SETDB1 regulates the epigenetic landscape of a subset of MLL-AF9 target genes. (A) Signal track for H3K9ac ChIP-seq centered around promoters of genes that have reduced H3K79me2 in MA9+SETDB1 relative to MA9+EV cells. (B) Signal track for ATAC-seq centered around promoters of genes that have reduced H3K79me2 in MA9+SETDB1 relative to MA9+EV cells. (C) Overlap analysis of genes that are downregulated by SETDB1 in acute myeloid leukemia (AML), have reduced H3K9ac ChIP-seq, ATAC-seq, or H3K79me2 ChIP-seq upon SETDB1 overexpression in AML, or MLL-AF9 direct binding targets (Bernt et al. 2011). (D) Sequencing tracks showing H3K79me2 ChIP-seq (top), H3K9ac ChIP-seq (second from top), ATAC-seq (third from top), and RNA-seq (bottom) signals for MA9+EV (blue) or MA9+SETDB1 (red) cells. Shown here is the Six1 gene locus. (E) ChIP-qPCR: anti-H3K9me3 or anti- immunoglobulinG (anti-IgG) immunoprecipitated DNA were subjected to quatitative PCR (qPCR) using primers for the promoter region of Six1 and Dock1. Shown is relative quantification compared to total anti-H3 immunoprecipitated DNA. n=2. (F) Anti-SETDB1 ChIP-seq track from the ENCODE project showing the SIX1 locus in K562 leukemia cells. Solid bars represent called peaks as reported by ENCODE. Statistics: differentially bound regions are defined by DiffBind false discovery rate (FDR) <0.05 (A/B/C); Significant gene expression changes are defined by DESeq2 algorithm with fold change >1.5 and padj<0.05 (C). For all ChIP-seq and ATAC-seq studies, n=2 for each cell condition. EV: empty vector control; n: biological replicates; *: P/padj<0.05. ChIP-seq: chromatin immunoprecipitation followed by sequencing; ATAC-seq: assay for transposase-accessible chromatin coupled with next-generation sequencing.
2282
haematologica | 2020; 105(9)
AB
CD
EF
