
Page 101 - 2020_09-Haematologica-web
P. 101
SETDB1 expression suppresses MLL-fusion driven AML
protein (Online Supplementary Figure S4C). Therefore, we utilizedshorthairpinRNA(shRNA)mediatedknockdown of Setdb1 using a doxycycline inducible MLL-AF9 Tet-on cell line in competitive growth assays. Interestingly, our
results were inconclusive where two shRNA constructs with efficient knockdown displayed negative selection, while two less efficient shRNA showed a positive selec- tion compared to MLL-AF9-Tet-on cells relative to the
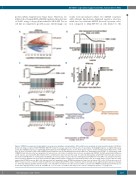
Figure 5. SETDB1 overexpression downregulates oncogenic gene programs and upregulates differentiation gene programs in acute myeloid leukemia. (A) MA plot shows fold changes of genes in MA9+SETDB1/ MA9+EV versus the average expression of those genes in all samples. Red highlighted genes are significantly upreg- ulated; blue highlighted genes are significantly downregulated; yellow highlighted genes are the Hoxa cluster of genes and the Hoxa9 cofactor Meis1 (n=3/ condi- tion). (B) Gene set analysis (GSA) using CAMERA shows that genes that are upregulated by Hoxa9 and Meis1 are downregulated by SETDB1. (C) GSA analysis using CAMERA shows that genes that are upregulated in mature blood cells relative to primitive blood cells are upregulated by SETDB1. (D) DESeq2-normalized RNA-seq counts of genes associated with differentiation (n=3/ condition). Error bars represent the range of counts. (E) GSA analysis using ROAST shows that genes that are directly bound by MLL-AF9 are downregulated by SETDB1. (F) Overlap analysis of genes that are downregulated by SETDB1 in mouse MA9 cells and genes that have reduced promoter H3K9me3 in acute myeloid leukemia (AML) patient samples compared to normal human CD34+ cells. (G) Overlap analysis of genes that are down- regulated by SETDB1 in mouse MA9 cells and genes that are upregulated upon SETDB1 knockdown by Crispr-Cas9 in human THP-1 cells. For both data sets in G, FDR of 0.1 was used as a cutoff for consistency with the previously published THP-1 dataset. Statistics: unless otherwise noted, significant gene expression changes are defined by DESeq2 algorithm with fold change >1.5 and padj<0.05 (A/D/F); false discovery rate (FDR) is calculated by CAMERA using Benjamani-Hochberg cor- rection (B-C); Hypergeometric tests (F-G). For RNA-seq, n = 3 for each cell condition. EV: empty vector control; n: biological replicates; *: P/padj<0.05.
haematologica | 2020; 105(9)
2279
AB
CD
E
F
G
G
