
Page 100 - 2020_09-Haematologica-web
P. 100
J. Ropa et al.
MLL-AF9 leukemic cells before injection and in bone mar- row of moribund mice and observed a decrease in exoge- nous SETDB1 expression in 6 of 8 mice (Figure 2K). These data demonstrate that SETDB1 expression suppresses MLL-AF9 mediated leukemic progression in vivo.
H3K9 methylation impairs HSPC colony formation and suppresses leukemic transformation
We examined how loss of Setdb1 affects normal HSPC
and AML growth and transformation. First, using inducible CreER-mediated knock-out of Setdb1, we con- firmed that Setdb1 is required for MLL-AF9 cell growth23 and demonstrated that Setdb1 is also required for the growth of E2A-HLF leukemic cells (Online Supplementary Figure S4A-B). We next sought to determine the effect of reduced expression but not deletion of Setdb1 on AML cell growth. However, heterozygous deletion of Setdb1 in MLL-AF9-Setdb1fl/+-CreER cells did not reduce Setdb1
AB
CD
EG
F
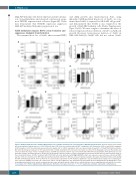
Figure 4. H3K9 methyltransferase inhibitor UNC0638 preserves primitive hematopoietic cells amenable to MLL-AF9 transformation. (A-G) Lin- mouse bone marrow was treated with the indicated doses of UNC0638 for 4 days. (A-D) Cells were stained with anti-CKIT conjugated to APC fluorophore (A-B) or anti-Cd11b conjugated to PE fluorophore (C-D). Flow cytometry was performed to analyze cKit+ or Cd11b– populations. (A/C) are representative flow plots for 0.75 μM UNC0638 treatments. B/D show the biological replicates for cKit+ populations (B) or Cd11b– populations (D) of treated cells relative to vehicle (n=3). Bar graphs represent the median and error bars show the range of these normalized values. (E) RNA was harvested after 4 days of treatment with UNC0638 and quantitative PCR (qPCR) was used to determine changes in Hoxa9 expression. Plotted are the biological replicates relative to vehicle. Bar graphs represent the median and error bars show the range of these normalized values. (F) After treatment with UNC0638, cells were spinfected with MigR1-MLL-AF9, which also expresses a green fluorescent protein (GFP) reporter. Cells were monitored for GFP expression by flow cytometry until 100% GFP was achieved. (G) Representative flow plots from different time points during the GFP monitoring experiment. For F-G: shown is one representative experiment of n=4. Statistics: significance was determined by two-sample t-test comparing rel- ative expression (Gapdh) of treated cells compared to vehicle cells (E). Significance was determined by generalized linear modeling followed by ANOVA where each treated group was paired to the vehicle treatment from the same biological replicate. Main effect is reported if there are no significant interactions(C-D) (see statis- tical analysis in the Online Supplementary Materials and Methods); n: biological replicates; *: P<0.05; Gapdh: glyceraldehyde 3-phosphate dehydrogenase.
2278
haematologica | 2020; 105(9)
