
Page 211 - 2019_03-Haematologica-web
P. 211
IL6ST variants lead to aberrant T-cell phenotype
responses in the patient-derived fibroblasts, whereas reduc- tions in p-STAT3 upon LIF and IL-27 stimulation were not significant (Figure 3C-E). Unlike IL-27, LIF, and OSM, upon receptor binding, IL-6 and IL-11 form a hexameric complex requiring two GP130 proteins, possibly explaining the extremity of their disrupted signaling. Moreover, PP498L’s fibroblasts showed a reduced p-STAT1 response upon IL-27 or OSM treatment compared to healthy donor fibroblasts (Online Supplementary Figure S2). In addition to STAT3, stim- ulation of fibroblasts with LIF induces phosphorylation of STAT4.20 Interestingly, in PP498L fibroblasts, LIF-induced p- STAT4 was slightly reduced when cells were starved in
serum-free media for 3 h (Figure 3F). To demonstrate causality of the novel IL6ST mutation on the observed phe- notype, we ectopically expressed WT-GP130 in GP130P498L fibroblasts. This rescued the defects in the IL-6 and IL-11 signaling pathways and compensated the partial reductions in LIF, IL-27 and OSM signaling (Figure 3A-E). Finally, over- expression of GP130P498L in HEK293-IL6ST KO cells mir- rored the defects observed in patient fibroblasts with signif- icant reductions upon stimulation with IL-6, IL-11, IL-27 and LIF, while STAT3 phosphorylation in response to OSM was reduced but did not reach statistical significance (P=0.0625) (Figure 4A-E).
AB
C
DE
F
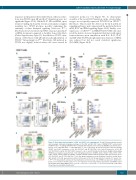
Figure 5. Phenotypic characterization of CD4+ and CD8+ T-cell compartments. (A and D) Representative dot-plot and bar graph summary showing percentages of (A) CD4+ and (D) CD8+ naïve (CD45RA+CCR7+) and memory [CD45RA–CCR7+/– including CD45RA+CCR7– terminally differentiated effector memory (TEMRA)] cells shown as fre- quency of live CD3+CD4+CD25– or CD3+CD8+CD25– T cells, respectively. (B and E) Bar graph summary showing CXCR3+ and CCR6+ frequencies of live (B) CD3+CD4+ and (E) CD3+CD8+ cells, and as frequencies of live (B) CD3+CD4+CD25– and (E) CD3+CD8+CD25– memory T cells. (C and F) t-Distributed Stochastic Neighbor Embedding (TSNE)-based analysis was performed on the following parameters: CD45RA, CD25, CD127, CCR4, CCR6, CCR7, CCR9, CCR10, CXCR3, CXCR5 and CRTh2. Overlaid heatmap statistics indicate median CCR6 expression in (C) live CD3+CD4+CD8– and (F) CD3+CD8+CD4– T cells. Bar graph summaries: mean+Standard Deviation: healthy donor (HD) (adult): n=19, HD age-matched controls (9-14 years): n=10-11, HD age-matched controls (6-7 years): n=6- 9, PP498L: n=5 independent replicates from peripheral blood mononuclear cells (PBMCs) isolated at 3 distinct time points, seven and four months apart, PN404Y: n=3 replicates from 2 independent experiments and PBMCs taken two months apart. Mann-Whitney test, *P<0.05; **P<0.01; ***P<0.001; ****P<0.0001. Some HD control data shown have been published previously.5
haematologica | 2019; 104(3)
617
