
Page 213 - 2019_03-Haematologica-web
P. 213
IL6ST variants lead to aberrant T-cell phenotype
ABC
DE
FG
H
I
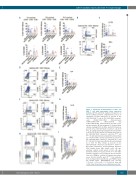
Figure 6. Functional characterization of CD4+ and CD8+ T cells with transcription factor expression analysis. (A) Flow cytometry analysis of frequencies of Th-cell subtype-enriched compartments based on chemokine receptor expression as percent of live CD3+CD4+CD25– T cells or CD3+CD4+CD25– memory T cells: CXCR3+CCR4–CCR6– (Th1-enriched), CCR4+CXCR3–CCR6– (Th2-enriched) and CCR6+CCR4+CXCR3– (Th17-enriched). (B and C) Dot- plot presentation (B) and summary (C) of intracellular cytokine staining (ICCS) for IFN-γ and IL-17A shown as percent of live CD3+CD4+CD25– memory T cells from PP498L. (D and E) Dot-plot presentation (D) and summa- ry (E) of ICCS for IL-4 and/or IL-13 shown as percent of live CD3+CD4+CD25– memory T cells from PP498L and PN404Y. (F and G) Dot-plot presentation (F) and summary (G) of ICCS for IFN-γ and/or IL-10 shown as percent of live CD3+CD4+CD25– memory T cells from PP498L and PN404Y (H and I) Dot-plot presentation (H) and summary (I) of ICCS for IFN-γ shown as percent of live CD3+CD8+CD25– memory T cells from PP498L and PN404Y. Bar graph summaries: mean+Standard Deviation (SD): healthy donor (HD) (adult): n=19, HD age- matched controls (9-14 years): n=7-11, HD age- matched controls (6-7 years): n=6-9, PP498L: n=5 inde- pendent replicates from peripheral blood mononu- clear cells (PBMCs) isolated at 3 distinct time points, seven and four months apart, PN404Y: n=3 replicates from 2 independent experiments and PBMCs taken five months apart. Mann-Whitney test; *P<0.05; **P<0.01; ***P<0.001; ****P<0.0001. Some HD control data shown have been published previously.5
haematologica | 2019; 104(3)
619
