
Page 135 - 2019_03-Haematologica-web
P. 135
ActivinA enhances BCP-ALL cell migration
BCP-ALL BM microenvironment to influence MSC- derived ActivinA. For this purpose, we isolated BM-MSCs from 15 HDs and 15 BCP-ALL patients at the onset of the disease. ALL-MSCs resulted comparable in terms of immunophenotype and adipogenic/osteogenic differenti- ation capacity to HD-MSCs (Online Supplementary Figure S8).
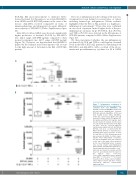
After 24 h of culture, ELISA assay showed a significantly higher production of ActivinA (P<0.05) by ALL-MSCs (mc: 222.2, range: 62.5-4855 pg/mL) compared to their normal counterparts (mc: 220.7, range: 62.5-518 pg/mL) (Figure 7A). Therefore, we hypothesized that BM-MSCs primed by the leukemic microenvironment could account for the high amount of ActivinA in the BM of BCP-ALL patients.
The role of inflammation in the editing of the microen- vironment has been defined in several types of cancer, including hematologic malignancies. Recent evidence highlighted that the BM of ALL patients is a highly pro- inflammatory environment.20 These data were confirmed in our cohort of patients. Indeed, higher levels of the pro- inflammatory cytokines IL-1b (P<0.0001), IL-6 (P<0.01), and TNF-α (P<0.01) were detected in the BM plasma of BCP-ALL patients compared to HDs (Online Supplementary Figure S9).
We then investigated whether the pro-inflammatory cytokines IL-1b, IL-6 and TNF-α could regulate ActivinA levels in the BM of BCP-ALL patients by stimulating both HD-MSCs and ALL-MSCs with a cocktail of the above- mentioned pro-inflammatory cytokines for 24 h. ELISA
A
B
Figure 7. Inflammation contributed to ActivinA production by bone marrow-mes- enchymal stem cells (BM-MSCs). (A) ActivinA secretion by BM-MSCs from B-cell precursor-acute lymphoblastic leukemia (BCP-ALL) patients (ALL-MSCs; n=15) and from healthy donors (HDs) (HD-MSCs; n=15) was assessed by ELISA after 24 hours (h) of culture ± IL-1b (50 ng/mL), IL-6 (40 ng/mL) and TNF-α (100 ng/mL). Each box plot shows the median and the mean (+), and extends from the lowest to the high- est value. *P<0.05; **P<0.01: Wilcoxon matched-pairs signed rank test. (B) Primary BCP-ALL cells were co-cultured with HD- MSCs directly (bottom) or separated by a Transwell insert (top) in presence of IL-1b, IL-6 and TNF-α for 72 h. ActivinA expression was assessed by ELISA on culture super- natants (n=17 independent co-cultures). The expected additive effect was calculated as the sum of the single effects produced by the two stimulating factors, leukemic cells (second column) and inflammation (third column). Synergism was defined as a “greater-than-the-expected-additive effect”. Each box plot shows the median and the mean (+), and extends from the lowest to the highest value. §§§P<0.001; §§§§P<0.0001: stimulated versus unstimu- lated MSC; ***P<0.001; ****P<0.0001: measured effect versus expected additive effect, indirect contact and direct contact, respectively; Wilcoxon matched-pairs signed rank test.
haematologica | 2019; 104(3)
541
