
Page 59 - Haematologica Vol. 110 - January 2025
P. 59
ARTICLE - IVIG prophylaxis in pediatric ALL
K.A. Thus et al.
P=0.030) (Table 2; Figure 3). The difference was more pro- nounced during maintenance treatment (78 vs. 137 in the IVIG prophylaxis and control groups, respectively; P<0.001) (Table 2; Figure 3).
The number of adaptations of chemotherapy after admission for fever was significantly smaller in the IVIG prophylaxis group than in the control group, during maintenance treat- ment (72 vs. 134, respectively, P<0.001) (Table 2; Figure 3). In per-protocol analyses, IVIG prophylaxis was associated with significantly fewer admissions for fever with negative blood cultures as well (108 vs. 198 in the IVIG prophylaxis and control groups, respectively; P<0.001) (Table 2; Figure
3), especially in the maintenance phase (52 vs. 125, respec- tively, P<0.001) (Table 2; Figure 3). IVIG prophylaxis resulted in significantly less empirical antibiotic therapy (78 vs. 136 courses in the IVIG prophylaxis and control groups, respec- tively; P<0.001) (Table 2; Figure 3), and fewer adaptations of chemotherapy (72 vs. 132, respectively; P<0.001) (Table 2; Figure 3) in the maintenance phase.
Relapse, disease-free survival and overall survival
There were seven relapses in the IVIG prophylaxis group and six in the control group. The 5-year relapse incidence was 8.4% (3.1%) and 7.5% (3.3%) for the IVIG prophylaxis and control
Table 2. Comparison of outcomes in the intravenous immunoglobulin prophylaxis and control groups, overall and during mainte- nance treatment separately.
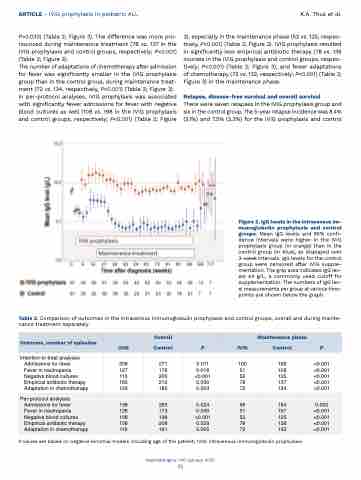
Figure 2. IgG levels in the intravenous im- munoglobulin prophylaxis and control groups. Mean IgG levels and 95% confi- dence intervals were higher in the IVIG prophylaxis group (in orange) than in the control group (in blue), as displayed over 3-week intervals. IgG levels for the control group were censored after IVIG supple- mentation. The gray area indicates IgG lev- els ≤4 g/L, a commonly used cutoff for supplementation. The numbers of IgG lev- el measurements per group at various time- points are shown below the graph.
Outcome, number of episodes
Overall
Maintenance phase
IVIG
Control
P
IVIG
Control
P
Intention-to-treat analyses Admissions for fever
Fever in neutropenia Negative blood cultures Empirical antibiotic therapy Adaptation in chemotherapy
206 127 113 165 123
271
176
200
212
185
0.011
0.016 <0.001 0.030 0.003
100 51 52 78 72
166
108
125
137
134
<0.001 <0.001 <0.001 <0.001 <0.001
Per-protocol analyses Admissions for fever
Fever in neutropenia Negative blood cultures Empirical antibiotic therapy Adaptation in chemotherapy
198 126 108 158 119
265
173
198
208
181
0.024
0.040 <0.001 0.029 0.005
99 51 52 78 72
164
107
125
136
132
0.002 <0.001 <0.001 <0.001 <0.001
P values are based on negative binomial models including age of the patient; IVIG: intravenous immunoglobulin prophylaxis.
Haematologica | 110 January 2025
51
