
Page 58 - Haematologica Vol. 110 - January 2025
P. 58
ARTICLE - IVIG prophylaxis in pediatric ALL
K.A. Thus et al.
Admissions for fever
In intention-to-treat analyses, we observed a total of 477 hospital admissions for fever, 206 in the IVIG prophylaxis group and 271 in the control group (P=0.011) (Table 2; Figure 3; for estimates of effect see Online Supplementary Table S2). Most of the admissions were for fever in neutropenia: 127 in the IVIG prophylaxis group and 176 in the control group (P=0.016) (Table 2; Figure 3). Patients in the youngest age quartile were more often admitted for fever than patients in the oldest quartile (304 [64%] admissions for fever in patients 1-4 years old, 21 [4%] in patients 15-18 years old) (Online Supplementary Table S3). Seven of 206 (3%) admissions for fever resulted in ICU admissions in the IVIG prophylaxis group and six of 271 admissions (2%) in the control group. The duration of admission was not different between the two groups, being a median of 4 days (interquartile range, 5 days) for the IVIG prophylaxis group and a median of 4 days (interquartile range, 3 days) for the control group (P=0.102). We next studied in which treatment phase IVIG prophylaxis was most relevant. Specifically, during maintenance treat- ment, there were significantly fewer admissions for fever in the IVIG prophylaxis group (N=100) than in the control group (N=166, P<0.001) (Table 2; Figure 3). In the maintenance phase, IVIG prophylaxis resulted in a more than 50% reduction of admissions for fever in neutropenia (N=51 and N=108 for the IVIG prophylaxis and control groups, respectively, P<0.001) (Table 2; Figure 3).
To investigate whether the effect of IVIG prophylaxis was influenced by a difference in follow-up time between the two groups of patients, we performed per-protocol analyses. These per-protocol analyses showed similar results: 198 hospital admissions for fever in the IVIG prophylaxis group and 265 in the control group (P=0.024) (Table 2; Figure 3). This difference was also attributed to significantly fewer admissions for fever in the maintenance phase (99 vs. 164 in the IVIG prophylaxis group and control group, respectively; P=0.002) (Table 2; Figure 3).
Blood cultures, antibiotics and chemotherapy adaptation
Although the exact cause of fever was highly diverse and mostly not (microbiologically) proven, in 440 (92%) admis- sions for fever blood cultures were performed. In the majority of admissions for fever, the blood culture was negative (313 of 440 blood cultures, 71%). In intention-to-treat analyses, the absolute number of admissions for fever with a positive blood culture was not significantly different between the IVIG prophylaxis group (N=69) and the control group (N=58, P=0.419), but detailed results regarding the exact pathogen were often not noted in the case report forms. However, IVIG prophylaxis was associated with significantly fewer admis- sions for fever with a negative blood culture (113 in the IVIG prophylaxis group and 200 in the control group, P<0.001) (Table 2; Figure 3). For the admissions with a negative blood culture, many different causes of fever were reported, the
majority being fever of unknown origin or upper respirato- ry tract infections (147 [47%] and 86 [27%], respectively), suggesting a viral infection. When analyzing the admissions for fever during maintenance treatment separately, IVIG prophylaxis was also associated with significantly fewer admissions for fever with a negative blood culture (52 vs. 125 in the IVIG prophylaxis group and the control group, respectively, P<0.001) (Table 2; Figure 3).
Patients in the IVIG prophylaxis group received significantly less empirical antibiotic therapy during admission for fever (165 courses) compared to the control group (212 courses,
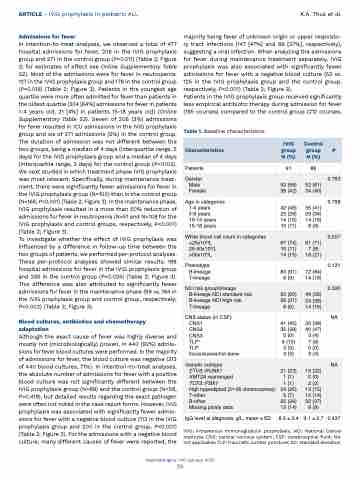
Table 1. Baseline characteristics.
Characteristics
IVIG group N (%)
Control group N (%)
P
Patients
91
86
Gender Male
Female
53 (58) 38 (42)
52 (61) 34 (40)
0.763
Age in categories 1-4 years
5-9 years 10-14 years 15-18 years
42 (46) 25 (28) 14 (15) 10 (11)
35 (41) 29 (34) 14 (16) 8 (9)
0.798
White blood cell count in categories <25x109/L
25-50x109/L
>50x109/L
67 (74) 10 (11) 14 (15)
61 (71) 7 (8) 18 (21)
0.557
Phenotype B-lineage T-lineage
83 (91) 8 (9)
72 (84) 14 (16)
0.131
NCI risk group/lineage B-lineage NCI standard risk B-lineage NCI high risk T-lineage
55 (60) 28 (31) 8 (9)
48 (56) 24 (28) 14 (16)
0.320
CNS status (in CSF) CNS1
CNS2
CNS3
TLP+
TLP-
Inconclusive/not done
41 (45) 35 (39) 0 (0) 9 (10) 3 (3) 3 (3)
33 (38) 40 (47) 3 (4) 7 (8) 0 (0) 3 (4)
NA
Genetic subtype
ETV6::RUNX1
KMT2A rearranged
TCF3::PBX1
High hyperdiploid (51-65 chromosomes) T-other
B-other
Missing ploidy data
21 (23) 1 (1) 1 (1) 24 (26) 6 (7) 25 (28) 13 (14)
19 (22) 0 (0) 2 (2) 13 (15) 12 (14) 32 (37) 8 (9)
NA
IgG level at diagnosis, g/L, mean ± SD
8.3 ± 2.4
9.1 ± 2.7
0.437
Haematologica | 110 January 2025
50
IVIG: intravenous immunoglobulin prophylaxis; NCI: National Cancer Institute; CNS: central nervous system; CSF: cerebrospinal fluid; NA: not applicable; TLP: traumatic lumbar puncture; SD: standard deviation.
