
Page 103 - Haematologica-5
P. 103
MSH6 haploinsufficiency contributes to resistance
through 120 h of thiopurine treatment (6-TG, P=0.013; 6- MP, P=0.001) compared to the MSH6 shRNA lines by one- way ANOVA (Figure 3A and Online Supplementary Figure S6A). MSH6 shRNA1 cells had only a modest decrease in growth with no clear S phase arrest (6-TG, P=0.011, and 6-MP, P=0.001, for percent of cells in S phase compared to NT at 120 h using Tukey’s multiple comparison test), even at higher concentrations of 6-TG (Figure 3A and Online Supplementary Figure S6A and B). MSH6 shRNA2 cells had a more moderate accumulation of cells in S phase and drop of cells in G1 (Figure 3B and Online Supplementary Figure S6A), which is consistent with the modest levels of knockdown and apoptosis. Similar trends were observed with UOCB1 cells (6-TG, P=0.31; and 6-MP, P=0.34 at 120 h) (Figure 3B). This more moderate effect observed with the UOCB1 cells is consistent with the degree of impact MSH6 knockdown had on chemoresistance compared to the 697 cells. Neither NT nor MSH6 shRNA1 Reh cells showed alterations in cell cycle upon exposure (Online Supplementary Figure S6B).
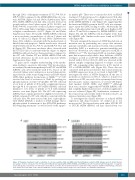
To gain a more complete understanding of the mecha- nism leading to apoptosis following TGN incorporation, we analyzed downstream pathways in 697 NT and MSH6 shRNA1 cells after treatment with 6-TG. Based on the observed S phase arrest and previous research demonstrat- ing activation of the ataxia telangiectasia and Rad3-related (ATR)-Chk1 pathway downstream of MMR,30,31 we first assessed the level of activation of Chk1 by probing for phosphorylation of serine 317 (pChk1). 697 NT cells had a low level of pChk1 at 48 h with a significant increase through 96 h of exposure. 697 MSH6 shRNA1 cells had minimal to low levels of pChk1 at 72 h with minimal increase over time (Figure 4A). The 697 cells expressing shRNA2 had a similar pattern but slightly lower levels of pChk1 compared to NT cells, which is consistent with the cell cycle data. We next assessed the level of phosphory- lated H2AX (γH2AX), a marker of DNA damage that is phosphorylated downstream of the ATR/ATM pathways following drug treatment,32 as well as levels of the apopto-
sis marker p53. There was a very modest level of γH2AX starting at 72 h that increased to a higher level at 96 h after treatment in 697 NT cells compared to very modest levels in the MSH6 shRNA1-2 cells (Figure 4A), suggesting that the functional MMR system in the NT cells was attempt- ing to repair the DNA, leading to nicks. Additionally, the levels of phosphorylated and total p53 were higher in NT cells at 72 and 96 h compared to MSH6 shRNA1-2 cells (Figure 4A) and the shRNA2 cells had higher levels than the shRNA1 cells. Similar results were found in UOCB1 cells (Figure 4B).
We next examined the impact of MSH6 knockdown on mutation rate by performing two assays that measure genomic instability and mutation burden. Microsatellite instability (MSI) is a marker for genomic instability and has been observed in cases where expression of MLH1 or MSH2 is lost.25,33 We investigated MSI on 2 patient sample pairs that we previously found to have deletions of MSH6 at relapse, as well as on 697 NT and MSH6 shRNA1 cells treated with 6-TG for 120 h. No MSI was observed in the patient samples comparing diagnosis to relapse or in the 697 cells comparing either untreated to 6-TG treated or NT to MSH6 shRNA1 cells (Figure 5A). These data are consistent with previous literature that found alterations in MSH6 expression alone do not lead to high MSI.34 To investigate the effect of MSH6 disruption on the rate of spontaneous mutations in PIG-A, which is required for expression of GPI, we used a flow cytometry-based assay that measures surface expression of several GPI-depen- dent markers (CD48, CD52, and CD59).22,35 Although there was a trend to suggest that 697 MSH6 shRNA1 cells had a slightly higher mutation rate, statistical significance was not achieved (Figure 5B). Furthermore, treatment of the clones from each cell line with 6-TG did not lead to an increased mutation rate (Figure 5B).
To investigate the clinical relevance of reduced MSH6 expression and drug resistance, we utilized an in vivo mouse model. We injected mice with either UOCB1 NT or UOCB1 MSH6 shRNA1 cell lines (knockdown con-
AB
Figure 4. Thiopurine treatment leads to activation of cell cycle regulator Chk1 and DNA repair that ultimately resulted in DNA damage and cell death. Western blot analysis of whole cell lysates from 697 (A) and UOCB1 (B) non-targeting (NT), MSH6 shRNA1, and shRNA2 cells after treatment with 6-thioguanine (0.1 μg/mL, and 0.025 μg/mL, respectively). (C) Untreated cells; numbers are hours after treatment. Blots were probed for Chk1 activation, γH2AX for DNA damage, and apop- tosis marker p53. Total Chk1, actin, and total H2AX were used as loading controls. Images are representative of 3 individual experiments.
haematologica | 2018; 103(5)
835
