
Page 102 - Haematologica-5
P. 102
834
N.A. Evensen et al.
measured the level of TGN incorporation into DNA upon treatment with 6-TG. 697 MSH6 shRNA1 cells accumulat- ed more TGN/μg DNA over time than NT cells (NT 1722 and KD 3070 fmol/μg DNA) (Figure 2A and C). In con- trast, no difference in TGN levels was observed in Reh cells (Figure 2B and C). Additionally, Reh cells had approx- imately 10-fold higher TGN levels compared to 697 cells (Figure 2A and B), highlighting the difference between MMR deficient and proficient cells in their ability to
respond to and survive thiopurine exposure. Thus, MMR proficient cells with high TGN succumb to the damage and therefore display less TGN/μg DNA over time, mean- while deficient cells tolerate higher levels of TGN.
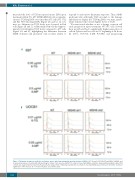
We next tested whether or not a change occurs in cell cycle progression upon treatment. 697 NT cells slowed their growth and had a significantly higher proportion of cells in S phase and less cells in G1 beginning at 96 hours (h) (6-TG, P=0.014; 6-MP, P=0.051) and progressing
A
B
Figure 3. Thiopurine treatment resulted in an S phase arrest, which was abrogated upon knockdown of MSH6. 697 (A) and UOCB1 (B) NT and MSH6 shRNA1 and 2 expressing cells were treated with indicated drug for 5 days. Cells were fixed with 70% ethanol, treated with RNAse, and then stained with propidium iodide. DNA content was analyzed by flow cytometry. Representative images from 3 individual experiments are shown. A one-way ANOVA was performed to determine statistical significance of the increase in % of cells in S phase at each time point.
haematologica | 2018; 103(5)
