
Page 58 - Haematologica-April 2018
P. 58
602
M.J. Kraakman et al.
we observed reduced stem cells in the BM with fewer
HSPCs and GMPs (Figure 3K). Interestingly, obese mice transplanted with NHD13 BM showed a trend towards restored CMP and MEP populations, despite terminal stage of the disease (Figure 3L). Next, we compared the gross morphology of the BM between the groups. While processing the bones in the obese NHD13 mice we observed two distinct phenotypes, which we traced back to mice dying due to MDS or transformation to AML. Thus, in the NHD13 mice we took the opportunity to explore the phenotype amongst mice that had died of either MDS or AML (Figure 3L). As expected, the BM from lean control mice appeared normal. When we explored the marrow of lean NHD13 mice with AML, we noted characteristic crowding of the marrow and dilated vessels, with an abundant number of cells that appeared to be leaving the marrow, compared to the NHD13 mice with MDS which presented with more disperse marrow. Again, as expected, adipocytes were more abundant in the BM of obese control mice compared with lean control mice, along with more megakaryocytes, as we have previ- ously described.20 However, the most notable change in the overall morphology was observed in the NHD13 obese mice. Those that died from AML had fewer adipocytes and more cellular marrow compared to the obese control mice, suggesting that the leukemic cells had used the lipid stored within these adipocytes for energy,
similar to the interaction between HSPCs and adipocytes post-BMT.21 Interestingly, NHD13 obese mice that died from MDS had almost a complete lack of cells in the BM, which was loaded with adipocytes, suggesting that hematopoiesis was likely being supported by another organ, and at this end-stage of disease showed complete BM failure. In addition, stem cells and progenitor cells that were increased in the spleen at the seven-month time point appeared to have become exhausted and were rap- idly maturing into myeloid cells (i.e., more GMPs; Figure 3L). Together, these data demonstrate a similar profile of hematological changes in obese and lean MDS mice at dis- ease endpoint, with a clear difference being the adiposity observed in the marrow of the obese NHD13 mice that died due to MDS.
Obese mice present with remodeled adipose tissue in response to MDS
Given that the blood profile did not provide an explana- tion for the prolonged survival of the obese mice with MDS, we sought an alternate explanation. Interestingly, when analyzing tissues after sacrifice, we noted that lean MDS mice had lost almost all of their body fat (Figure 4A). In contrast, the obese mice, which started with substan- tially more fat mass, retained the majority of their adipos- ity when facing MDS. Indeed, when expressed as a per- centage relative to mice without MDS, lean MDS mice
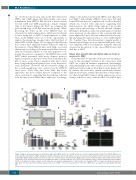
AB
CDE
FG
Figure 4. Adipose tissue parameters in Ob/Ob mice subjected to MDS. Ob/Ob mice and WT littermate controls transplanted with either WT or NHD13 BM were fol- lowed until the development of MDS symptoms required euthanasia. After death, adipose tissues were dissected and analyzed. (A) Fat and lean mass measured by EchoMRI. (B) Percentage weight loss relative to respective control groups. (C) Representative H&E stained section of visceral adipose tissue (VAT). (D) Flow cytom- etry analysis of VAT stromal vascular fraction, including percentages of activated myeloid cells (CD11b+), macrophages (F4/80+) and pro-inflammatory macrophages (CD11c+). (E) Adipocyte number analysis and (F) adipocyte size analysis using Image Pro J. (G) PicroSirius red staining of VAT for collagen visualization in polarized light. (A-B); n=9-16; (C-G); n=4-8. All data expressed as mean ± SEM. *P<0.05, for obesity effect; #P<0.05, for MDS effect as analyzed by 2-way ANOVA. WT: wild- type.
haematologica | 2018; 103(4)
