
Page 59 - Haematologica-April 2018
P. 59
Obesity and myelodysplasia
had lost almost 75% of their fat mass at the time of sacri- fice, while obese mice had only lost 20% of their fat mass overall, thus maintaining a stable percentage of body fat mass (Figure 4B, Online Supplementary Figure S3). Of note, examining endpoint lean mass revealed that obesity did not protect against muscle cachexia, as lean and obese
MDS mice lost comparable amounts of lean mass (Figure 4A,B). However, at the 37-week time point, when all the lean NHD13 mice had died, the obese NHD13 still had lean mass equal to control WT mice, suggesting that their lean mass had not fallen to dire levels (Online Supplementary Figure S3B). Exploring the morphological
A
BCD
EF
GHI
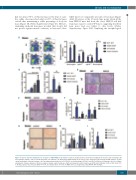
Figure 5. Spleen and liver parameters in response to MDS/AML in Ob/Ob mice. Spleen analysis by flow cytometry including (A) monocytes and neutrophils, (B) macrophages (F4/80+) and (C) activated myeloid cells (CD11b+). (D) Histological H&E staining of the spleen. Liver analysis by (E) histological H&E analysis, (F) flow cytometry analysis of hepatic immune cells, including activated myeloid cells (CD11b+) and macrophages (F4/80+) and (G) PicroSirius red staining of liver for collagen visualization. Plasma analysis of (H) liver enzymes alanine amino transferase (ALT) and aspartate amino transferase (AST) and (I) bilirubin. (A-G); n=4-8; (H-I); n=5- 7. All data expressed as mean ± SEM. *P<0.05, for obesity effect; #P<0.05, for MDS effect as analyzed by 2-way ANOVA. WT: wild-type.
haematologica | 2018; 103(4)
603
