
Page 56 - Haematologica-April 2018
P. 56
M.J. Kraakman et al.
Obese mice display prolonged survival when challenged with myelodysplastic syndrome despite increased myelopoiesis
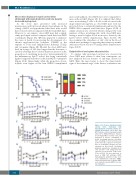
As the obese mice presented with increased myelopoiesis with increased splenic macrophages in the setting of MDS, we hypothesized that these mice would have reduced survival compared with the lean MDS mice. However, to our surprise, obese MDS mice had a signifi- cantly prolonged survival compared with their lean MDS counterparts (Figure 2A). Obesity appeared to influence the cause of death, by promoting the development of a chronic myelomonocytic leukemia (CMML) at the expense of T-cell acute lymphoblastic leukemia (T-ALL) and cytopenias (Figure 2B). Overall, the obese MDS mice lived an average of 100 days longer than the lean mice, a survival advantage that occurred despite an increase in the proportion of circulating monocytes, driven primarily by the inflammatory Ly6-Chi subset, this being consistently higher compared with those in the lean MDS counterparts (Figure 2C-E). Interestingly, while the proportion of neu- trophils were higher in the lean NHD13 transplanted
mice, neutrophils in obese MDS mice were comparable to mice without MDS (Figure 2F). It is unlikely that differ- ences in circulating T cells or B cells could account for the improvement in longevity, as obese MDS mice were not protected from a sustained lymphopenia induced by the NHD13 BM compared with lean mice (Figure 2G,H). A similar situation was observed when looking at the total numbers of these circulating cells, with obese MDS mice having a trend to higher blood monocytes, driven by the Ly6-Chi subset (Online Supplementary Figure S2A-D). We also examined the abundance of ckit+ cells in the blood, which were unchanged, suggesting that refractory anemia with excess blasts was not occurring (Online Supplementary Figure S2E,F).
Endpoint blood and spleen characteristics
To explore why prolonged survival was observed in obese MDS mice relative to their lean counterparts, we first analyzed the key features of end-stage disease for MDS. Once the mice began to show the characteristic signs of the terminal stage of the disease, euthanasia was
AB
CD
E
G
F
H
Figure 2. Ob/Ob mice display prolonged
survival when
myelodysplastic syndrome despite pre- existing monocytosis. Ob/Ob mice and WT littermate controls transplanted with either WT or NHD13 BM were followed for (A) Kaplan-Meier survival curve. (B) Proportion of disease contributing to death. Circulating myeloid cell popula- tions, including (C) total monocytes, (D) Ly-6Chi monocytes, (E) Ly-6Clo monocytes and (F) neutrophils analyzed by flow cytometry on lysed blood. Circulating lymphoid populations, including (G) B cells and (H) T cells analyzed by flow cytometry on lysed blood. (A,B); n=16; (C-H); n=12-16. All data expressed as mean ± SEM. WT: wild-type; MDS: myelodysplastic syndrome; T-ALL: T-cell acute lymphoblastic leukemia; CMML: chronic myelomonocytic leukemia; AML: acute myeloid leukemia; BMT: bone mar- row transplant.
challenged with
600
haematologica | 2018; 103(4)
