
Page 55 - Haematologica-April 2018
P. 55
Obesity and myelodysplasia
A
B
E
C
D
F
H
G
I
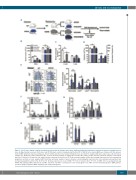
Figure 1. Ob/Ob mice display a similar hematopoietic phenotype to wild-type mice when challenged with myelodysplastic syndrome despite pre-existing monocy- tosis. (A) Experimental overview: Ob/Ob mice and WT littermate controls transplanted with either WT or NHD13 bone marrow (BM) were followed until the develop- ment of MDS symptoms required euthanasia. Seven months after the bone marrow transplant, mice were bled for analysis (B-E) and a subset was culled for tissue analysis (F-I). (B) Blood counts obtained by CBC, (C) flow cytometry analysis of lymphocytes and (D) CBC platelet counts and flow cytometry analysis of reticulated platelets (% platelets). (E) myeloid cells analysis by flow cytometry on lysed blood. (F) Flow cytometry analysis of BM cells including long term stem cells and myeloid progenitors, and (G) cell cycle analysis (DAPI). (H-I) Flow cytometry analysis of spleen immune cells including (H) long term stem cells and myeloid progenitors and (I) myeloid populations. (A-E); n=12-16; (F-I); n=3. All data expressed as mean ± SEM. *P<0.05, for obesity effect; #P<0.05, for MDS effect as analyzed by 2-way ANOVA. WT: wild-type; WBC: white blood cell; RBC: red blood cell; HSPC: hematopoietic stem and progenitor cell; CMP: common myeloid progenitor; GMP: granulo- cyte-macrophage progenitor; MEP: megakaryocyte-erythroid progenitor.
haematologica | 2018; 103(4)
599
