
Page 170 - Haematologica-April 2018
P. 170
714
D. Belloni et al.
the co-cultures (Figure 5E), recapitulating the native BM microenvironment.31 Of note, cytokine concentrations were significantly higher in 3D than in 2D conditions (Figure 5F).
Impact of bortezomib on a 3D culture of primary MM cells and stroma
We next investigated whether our reconstructed model was suitable to assess sensitivity to bortezomib of pri- mary MM cells within their microenvironment. To this aim, we performed parallel cultures in bioreactor in the presence/absence of bortezomib, using primary MM cells obtained from 6 patients. Scaffolds were coated with pri- mary MM BMSC and HUVEC to better approximate the native microenvironment.12 After 48 h MM cells were retrieved from scaffolds and submitted to FACS analyses. Bortezomib-induced death, which varied among patients, could be determined as percentage of CD38+AnnV+ MM cells (Figure 6A and B). Bortezomib cytotoxicity could also
be evaluated by IHC, showing down-modulated expres- sion of CD138 antigen in caspase-3+ MM cells undergoing apoptosis32 (Figure 6C) and through the assessment of spe- cialized functions. In particular, MMP-2 and MMP-9 activ- ities (Figure 6D), as well as Ang-2 and IL-6 concentrations (Figure 6E), significantly decreased in supernatants from bortezomib-treated scaffolds, underlining the impact of the drug also on stroma.
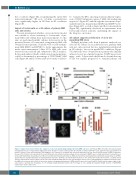
3D culture supports proliferation of an in vivo expanding MM clone
Multiple myeloma cells from 6 patients analyzed sur- vived in 3D culture. In an additional case, primary MM cells not only survived but also significantly proliferated in 3D cultures, but not in parallel 2D conditions (Figure 7A). MM cells were obtained from a patient who initially achieved a very good partial response (VGPR) upon treat- ment with bortezomib-thalidomide-dexamethasone (VTD) but rapidly progressed to terminal plasma cell
AB
CDE
Figure 7. Culture in bioreactor mirrors the expansion of an in vivo proliferating multiple myeloma (MM) sub-clone. (A) Primary MM cell number (left panel) and β2 microglobulin release in supernatant (right panel) after 14 days of culture under parallel 2D and 3D co-cultures with HS-5 cells. (B) Schematic representation of patient’s clinical course and treatments. After diagnosis (t0), response to treatment was assessed and defined as Very Good Partial Response (VGPR), Progressive Disease (PD), Plasma Cell Leukemia (PCL). Serum M protein concentration and percentage of bone marrow PC (BMPC) were serially determined. Treatments were: bortezomib-thalidomide-dexamethasone (VTD), bortezomib-doxorubicin-dexamethasone (PAD), bortezomib-cyclophosphamide-lenalidomide-dexamethasone (VCRD), dexamethasone-cisplatin-adriamycin-cyclophosphamide-etoposide (D-PACE). (C) Immunohistochemistry of the proliferation marker Ki-67 inside a scaffold (lower) and in a matched bone biopsy (upper). Insert represents CD138 staining. Bar=100 mm. (D) Interphase fluorescence in situ hybridization analysis performed in puri- fied MM cells retrieved upon culture in bioreactor (upper), showing normal pattern of ATM and p53 (upper left) and 13q14.3/13q34 deletion (upper right); in the lower panel, a spontaneous metaphase of a PC showing 13q14.3/13q34 deletion. (E) Percentage of cells carrying the 13q14.3/13q34 deletion or IGH/FGFR3 translocation ex vivo and in vivo.
haematologica | 2018; 103(4)
