
Page 104 - Haematologica-April 2018
P. 104
648
C. Oudin et al.
40.2%, respectively; P<0.001). Furthermore, controls (IPC group) had a higher mean body mass index (BMI) than LEA patients (23.7±4.71 and 23.3±4.46 for IPC and LEA patients, respectively; P=0.01).
Prevalence of metabolic syndrome: comparison between the LEA and the IPC groups
The metabolic syndrome prevalence was 10.3% (n=106/1025) in the LEA group and 4.5% (n=145/3203) in the IPC group (P<0.001), with an OR of 2.49 (95%CI: 1.91-3.25) (Table 3). The metabolic syndrome occurred in 9.7% of female LEA patients, whereas the syndrome occurred in 4% of control females (OR: 2.56, 95%CI: 1.75- 3.74; P<0.001). Metabolic syndrome was observed in 11%
A
of male LEA patients and 5% of male controls (OR: 2.33, 95%CI: 1.63-3.34; P<0.001).
Since blood pressure is the variable the most affected by fluctuations and might be overestimated in some cases, we analyzed the metabolic syndrome occurrence exclud- ing the hypertension criteria: 46 LEA patients (4.5%) had a metabolic syndrome versus 66 controls (2.1%). The dif- ference was still statistically significant (P<0.001).
We analyzed the cumulative incidence of the metabolic syndrome among LEA patients over time: 7.86% (95%CI: 5.99-10.29) at 25 years, and 14.42% (95%CI: 11.22-18.43) at 30 years (Online Supplementary Appendix).
Prevalence of the metabolic syndrome components
B
C
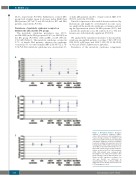
Figure 1. Biological markers. Biological markers of metabolic syndrome (triglyc- erides, HDL-cholesterol and fasting glucose levels) among Leukemia in Childhood and Adolescents (LEA) cohort patients displaying a metabolic syndrome (n=106) according to treatment modality: hematopoietic stem cell transplantation (HSCT) with total body irradi- ation (TBI): n=39; HSCT without TBI: n=7; no HSCT with central nervous system (CNS) irra- diation: n=18; no HSCT/no CNS irradiation: n=42. LEA patients were compared with Investigation and Clinical Prevention (IPC) group patients (controls) with metabolic syn- drome (n=145), adjusted according to sex and age. Results are expressed as mean±Standard Error of Mean (SEM). (A) Triglyceride levels. (B) HDL cholesterol levels. (C) Fasting glucose levels.
haematologica | 2018; 103(4)
