
Page 106 - Haematologica-April 2018
P. 106
C. Oudin et al.
receiving TBI, compared with males from the IPC cohort, were also at higher risk of metabolic syndrome [OR=4.13 (95%CI: 2.26-7.56); P<0.001]. Transplanted patients with- out TBI had also a higher risk of metabolic syndrome, even if it did not reach the significance threshold (OR=2.18, 95%CI: 0.97-4.86; P=0.057). We also found that patients who underwent CNS irradiation were more likely to develop metabolic syndrome compared with controls [OR= 2.32 (95%CI: 1.36-3.97); P=0.002].
Interestingly, patients who received chemotherapy only were also more likely to develop metabolic syndrome
than controls [OR= 1.68 (95%CI: 1.17-2.41); P=0.005] (Table 3).
Age at diagnosis or at transplantation did not impact the metabolic syndrome risk among the LEA patients.
Metabolic syndrome profile: impact of treatment modalities
We also aimed to determine whether the metabolic pro- file among patients who had a metabolic syndrome was different between LEA patients and controls. This is the
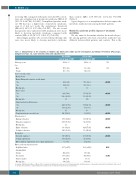
Table 2. Characteristics of the Leukemia in Children and Adolescents (LEA) and the Investigation and Clinical Prevention) (IPC) groups. Comparison of age, sex, socio-economic status and education level.
IPC n=3203 LEA n= 1025 n(%)ormean±SEM n(%)ormean±SEM
P
NS NS
<0.001
<0.001
<0.001
<0.001 <0.001
<0.001
<0.001
0.01
<0.01
Mean age, years Sex
Male
Female
Socio-economic status
Marital status
Married/living with a partner or with family
Yes
No
Missing data House-owner
Yes
No
Missing data
Supplementary health insurance
Yes
No
Missing data
Complementary free medical care
Education level Ongoing education Education completed Missing data
Higher education
No higher education
Occupation
Currently employed
Seeking employment
Other (without employment, not seeking employment)
Other cardio vascular risk factors Body Mass Index
Smoking habits
Smoker
Non smoker
Former smoker
Missing data
24.4 ± 0.1
1573 (49) 1630 (51)
2016 (64) 1134 (36) 53
234 (7.4%) 2930 (92.6%) 39
2123 (67.1%) 1039 (32.9%) 41
446 (16.2%)
1095 (34.4%) 2087 (65.6%) 21
930 (40.2%) 1385 (59.8%)
987 (47.3%) 1099 (52.7%) 0 (0.0%)
23.7 (±4.71)
854 (26.7) 1708 (53.3) 242 (7.6) 398 (12.4)
24.4 ± 0.2
501 (49) 524 (51)
731 (82.0) 161 (18.0) 11
117 (18.7%) 510 (81.3%) 276
794 (92.0%) 69 (8.0%) 40
39 (4.5%)
368 (41.1%) 52 (58.9%) 8
424 (57.8%) 310 (42.2%)
408 (79.5%) 92 (17.9%) 13 (2.6%)
23.3 (±4.46)
185 (18) 493 (48.1) 9 (0.9) 338 (33)
650
n: number; SEM: Standard Error of Mean; NS: not significant. Significant values are in bold. Supplementary health insurance is typically purchased by individuals with a good economic status,whereas complementary free medical care is dedicated only to the poorest patients.
haematologica | 2018; 103(4)
