
Page 103 - Haematologica-April 2018
P. 103
Metabolic syndrome in childhood leukemia survivors
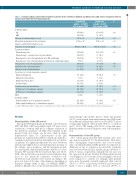
Table 1. Leukemia subtypes and treatment regimen in patients in the Leukemia in Children and Adolescents (LEA) cohort. Comparison between included and eligible but non-included patients.
Leukemia subtype ALL
AML
Mean age at leukemia diagnosis, years
Mean follow-up duration (between leukemia diagnosis and last LEA evaluation), years Total dose of steroids, mg/m2
Treatment modalities
Chemotherapy alone
Chemotherapy + central nervous system irradiation
Hematopoietic stem cell transplantation after TBI conditioning Hematopoietic stem cell transplantation after Bu-based conditioning regimen
Hematopoietic stem cell transplantation
Autologous stem cell transplantation
Allogeneic stem cell transplantation
Donor type (n, % of allo-transplant recipients)
Matched sibling donor Mismatched related donor Matched unrelated donor Cord blood unit
Central nervous system irradiation
18 Grays (n, % of irradiation recipients)
24 Grays (n, % of irradiation recipients) Other
Irradiation subtype
Cranial irradiation (n, % of irradiation recipients)
Cranio-spinal irradiation (n, % of irradiation recipients)
Included LEA patients (n=1025) n(%) or mean ± SEM
867 (84.6) 158 (15.4) 8.37 ± 0.15 16.32 ± 0.21
4688.28 ± 148.35
637 (62.2) 143 (13.9) 168 (16.4) 77 (7.5) 245 (23.9) 65 (26.5) 180 (73.5)
105 (62.1) 9 (5.3) 32 (18.9) 23 (13.6) 168 (16.4) 128 (76.2) 28 (16.7) 8 (4.8)
122 (72.6)
44 (26.2)
Eligible non- P included (n=437)
n(%) or mean ± SEM
379 (86.7) 0.29 58 (13.3)
8.50 ± 0.23 0.63 15.64 ± 0.33 0.08
4880.52 ± 195.31 0.43
261 (59.7) 0.20 70 (16.0)
83 (19.0)
23 (5.3)
106 (24.3) 0.88
24 (22.6) 0.65
82 (77.4)
47 (61.8) 0.96 5 (6.6)
15 (19.7) 9 (11.8)
77 (17.7) 0.53
54 (70.1) 0.08
13 (16.9) 10 (130)
61 (79.2) 0.32
16 (20.8)
n: number; SEM: Standard Error of Mean; ALL: acute lymphoblastic leukemia; AML: acute myeloid leukemia; TBI: total body irradiation; Bu-based: busulfan-based.
Results
Characteristics of the LEA cohort
Among the 3188 participants in the LEA cohort between 2007 and 2014, 1462 were eligible (aged >18 years at last evaluation) of whom 1025 had a complete evaluation of the metabolic syndrome; all 1025 were included in the present study (for details, see the flow chart in Online Supplementary Figure S1). Characteristics of the LEA patients are summarized in Table 1, which also includes a comparison between included and eligible but not includ- ed patients. No significant difference was noted between included and eligible but not included patients in terms of AL subtype, age at diagnosis, and AL treatment modali- ties. Among the 1025 included patients, 524 (51.1%) were females; 867 patients (84.6%) had had ALL and 15.4% AML. The mean follow-up duration from leukemia diag- nosis to last metabolic syndrome evaluation was 16.32±0.21 years. Patients were treated according to the protocols in use at the time of AL diagnosis, depending on leukemia subtype (AML or ALL) (i.e. FRALLE, EORTC, LAME or ELAM). Most of the included patients received
chemotherapy only (n=637, 62.2%), while 143 patients (13.9%) were treated with chemotherapy and CNS irradi- ation. Overall, 245 patients (23.9%) received HSCT after a conditioning regimen with (n=168, 68.6%) or without (n=77, 31.4%) TBI. Finally, 180 (73.5%) of the 245 trans- planted patients received allogeneic stem cell transplanta- tion.
Characteristics of the IPC group
The control group included 3203 patients who were age- and sex-matched 3:1 to the LEA patients. Table 2 pro- vides demographic characteristics and socio-economic data concerning the LEA and IPC patients. As expected, no difference in age at evaluation for metabolic syndrome was noted between the LEA and IPC groups (24.4±0.2 vs. 24.4± 0.1 years, respectively). Similarly, the sex ratio was the same in both groups. Notably, the LEA patients had an overall higher socio-economic status and higher education level compared to controls; for example, LEA patients were more frequently currently employed than controls (79.5% vs. 47.3%, respectively; P<0.001) and were more likely to have a higher level of education (57.8% vs.
haematologica | 2018; 103(4)
647
