
Page 39 - Haematologica3
P. 39
Modeling human erythroid-macrophage interactions
Supplementary Figure S1A depicts distinct morphological changes upon dexamethasone-induced differentiation between freshly isolated CD14+ monocytes and cultured CD14+ cells. Monocytes were incubated with mifepris- tone, which blocks glucocorticoid receptor activation. Membrane and messenger ribonucleic acid (mRNA) expression of CD16, CD163, and CD206 was significantly reduced by mifepristone treatment, and thus dependent on glucocorticoid receptor transcriptional control (Figure 1E and Online Supplementary Figure S1B,C). Although neither Figure 1C nor Figure 1E show an effect of dexamethasone on the fluorescence intensity of CD169, mRNA levels of CD169 were clearly increased upon stimulation of the glu- cocorticoid receptor and reduced when cells were treated with mifepristone. In contrast, CXCR4 mRNA levels did not change upon mifepristone treatment, but membrane expression was increased (Online Supplementary Figure S1B). Monocyte differentiation increases expression of DC-SIGN independently of dexamethasone, albeit to
expression levels that are significantly lower compared to dendritic cells (Figure 1E and Online Supplementary Figure S1C).26 Note that cultured monocytes in all conditions are a homogeneous population, as single peaks observed in histograms and multi-color flow cytometry data revealed that monocytes stimulated with glucocorticoids are CD16+CD163+CD169+CXCR4+CD206+ cells (Online Supplementary Figure S1C,D). Interestingly, flow cytometry data revealed that monocytes that have been differentiated for three days in the presence of dexamethasone were unable to change their phenotype after 4 or 24 hours of mifepristone treatment. Only CD163 expression was slightly reduced after 24 hours mifepristone treatment (Online Supplementary Figure S1E). The data indicates that glucocorticoid stimulation initiates an irreversible differen- tiation program of monocytes towards CD16+CD163+CD169+CXCR4+CD206+ macrophages which is maintained for at least 17 days of culture (Online Supplementary Figure S2A,B).
A
B
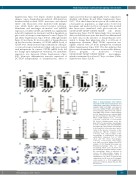
Figure 3. GC-macrophages form erythrob- last clusters with increased frequency and erythroblast composition. (A) Expression of integrins ITGA4 and ITGB1 and adhesion molecules ICAM1, PECAM, and VCAM1 on GC-macrophages (Mφ) (n=6) and erythrob- lasts (EBL) at day 1 and 7 of differentiation (n=3-4). Mean fluorescence intensity (MFI) has been normalized to the isotype control.
CD Mean ± SEM (unpaired t-test, *P<0.05, **P<0.01, ***P<0.001, ****P<0.0001). (B) Scaled cell-displacement vector dia- gram (left; 20 representative macrophages in both conditions) and box-and-whisker plot (right; 68 representative macrophages in -Dex and 21 in +Dex) after three days of culture in the absence or presence of dex- amethasone. (Welch's unpaired t-test, **P<0.01, n=5). (C-D) Co-culture of GC- macrophages or unstimulated cells with erythroblasts (unpaired t-test of 1153 (-Dex) and 749 (+Dex) macrophages, **P<0.01, ****P<0.0001, n=5). Images were taken every hour during 64 hours of E analysis. (C) Plot showing the average ery- throblast-macrophage links for each macrophage. Mean ± SD. (D) 5-95% box plot showing the maximum number of links per macrophage. Mean is indicated by crosses. (E) Representative images of cytospins of GC-macrophages (+Dex) or unstimulated cells (-Dex) co-cultured with erythroblasts for 24 hours (in 50x magnifi- cation, panels i-ii or 100x magnification, panels iii-v; n=4). Dex: dexamethasone; ND:
not detected.
haematologica | 2018; 103(3)
399
