
Page 40 - Haematologica3
P. 40
E. Heideveld et al.
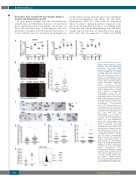
Proteomics data revealed GC-macrophages display a distinct anti-inflammatory profile
To gain further insights into the dexamethasone- induced monocyte differentiation process, we performed mass spectrometry-based quantitative proteomics on these cells after three days of differentiation and com- pared this to non-glucocorticoid stimulated monocytes. A total of 3,210 proteins were quantified, and principal com-
A
B
ponent analysis clearly separated glucocorticoid-stimulat- ed from non-stimulated cells (Figure 2A and Online Supplementary Table S1). Glucocorticoid stimulation induced a distinct expression pattern compared to non- glucocorticoid stimulated monocytes, as visualized in the volcano plot and corresponding heatmap of the 169 differ- entially expressed proteins for individual donors (Figure 2B,C). Note that the expression of CD163 and CD206
EF arrow), reticulocytes (arrowhead) and phagocytose pyrenocytes (small arrow) and some erythroid cells dur- ing differentiation (asterisk). 10- 90% box plots showing the number of nucleated cells (D) or reticulo- cytes (E) bound to macrophages (Mφ). (F) Scatter plot showing the number of pyrenocytes bound to or phagocytosed by macrophages. Mean ± SD. (G) Graph showing the binding of CD235a+ differentiated erythroid cells to GC-macrophages versus unstimulated cells. Corresponding histogram showing geometric mean of CD235a in FITC (n=4). Mean ± SEM (paired t-test, **P<0.01). HLA-DR: human leuko- cyte antigen – antigen D-related; MFI: mean fluorescence intensity;
Figure 4. GC-macrophages can bind erythroid cells and phagocytose pyrenocytes. (A) Relative mRNA expression of TAM-receptor family members MERTK, AXL and TYRO3 on CD14+ cells (D0) cultured for three days (D3) in the presence or absence of dexamethasone (Dex). 20μM mifepristone (Mif) was added for three days or after three days for 4 hours (n=4). Mean ± SEM (ratio paired t-test, *P<0.05, ****P<0.0001). (B) Representative ImageStreamX images of zymosan (green) phagocytosed by HLA-DR (red) positive unstimulated macrophages (-Dex) and GC- macrophages (+Dex) (left), and cor- responding 10-90% box plot show- ing the number of zymosan particles phagocytosed (right) (unpaired t-test of 1285 -Dex and 530 +Dex macrophages, ****P<0.0001, n=3). (C-F) GC-macrophages and unstimulated cells were co-cultured for 24 hours with day 6 differentiat- ed erythroid cells (unpaired t-test of
370 –Dex and 313 macrophages, ****P<0.0001, n=3). (C) Representative images of cytospins (in 50x magnification, panels i-ii or 100x magnification, panels iii-v). Macrophages bind nucleated erythroid cells (large
ns: not significant; BF: bright-field.
+Dex
400
C
D
G
haematologica | 2018; 103(3)
