
Page 41 - Haematologica3
P. 41
Modeling human erythroid-macrophage interactions
(MRC1) was highly induced after glucocorticoid receptor activation, corroborating the flow cytometry experiments. The most differentially expressed proteins (n=169) were mapped to evaluate specific upregulation or downregula- tion of functionality-linked protein networks, based on the Search Tool for the Retrieval of Interacting Genes/Proteins (STRING) analysis (Figure 2D). CD163 and CD206 are part of an interactome protein node that is specifically upregulated in dexamethasone-induced macrophages, and includes M2 macrophage markers CSF1R, stabilin-1 (STAB1) and complement proteins C3AR1, C1QC, and FcγRIIa (CD32) which has been asso- ciated with high phagocytic capacity of the cells. Moreover, VSIG4 was upregulated in dexamethasone- induced macrophages, which is restricted to resting tissue macrophages,27 while ABCA1 was also upregulated, which has been highly associated with hemoglobin-asso-
ciated macrophages.28 In addition, proteins with a positive regulation of cell migration and motility, including DAB2, ADAM9, Serpine1 (PAI1) and CD81, are upregulated in dexamethasone-induced macrophages. Furthermore, a whole range of signaling receptors were upregulated, amongst which are TGF and IFNγ receptors (TGFBR1 and IFNGR1) and IL13RA1. These proteins belong to process- es that are enriched as GO-term, e.g., membrane part, sig- nal transducer activity, transmembrane receptor activity and molecular transduced activity. In addition, many immune regulatory processes are also enriched (Figure 2E and Online Supplementary Table S2). Interestingly, members of the cathepsin family involved in antigen presentation (e.g., CTSC, CTSL1, CTSD and CTSS) were downregulat- ed. A range of pro-inflammatory proteins, clustered with- in an interactome node, were downregulated; these include lysosomal enzymes HEXA and HEXB, MANBA,
ABC
D
E
F
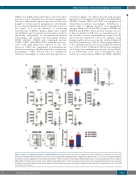
Figure 5. CD163+ macrophage populations in human BM and FL. (A) Representative dot plots of erythroid cells characterized by the expression of CD71high and CD235a in total human BM (n=4) and FL mononuclear cells (n=4). (B) Graph belonging to panel A. Mean ± SD (unpaired t-test, ***P<0.001). (C) Graph showing the percentage of CD163+ cells present in the total cell population in BM (n=7) and FL (n=5). Mean ± SEM (unpaired t-test, **P<0.01). (D) Characterization of CD163+ macrophages in human BM (n=3-7) and FL (n=3-5) based on the expression of CD14, CD16, CD163, CD169, CXCR4, CD206 and VCAM1. Mean fluorescence intensity (MFI) has been normalized to the isotype control. Mean ± SEM (unpaired t-test, **P<0.01). (E) Representative dot plots of erythroid-macrophage clusters formation of erythroid cells (CD71highCD235a+) with CD163+ BM (n=4) and FL (n=4) macrophages. (F) Graph belonging to panel E. Mean ± SD (unpaired t-test, *P<0.05). BM: bone marrow; FL: fetal liver.
haematologica | 2018; 103(3)
401
