
Page 84 - 2020_08-Haematologica-web
P. 84
G. Kooij et al.
A
B
C
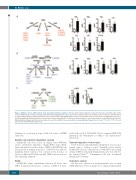
Figure 2. Multiple sclerosis (MS) patients show altered lipid mediators profiles in blood. Lipid mediators (LM) were isolated from plasma of healthy subjects (HS, n=15) and MS patients (n=38) and analyzed by liquid chromatography tandem mass spectrometry. (A) Schematic representation of the arachidonic acid (AA)-derived respective LM biosynthetic pathways and their selected values between HS and MS. (B) Schematic representation of the docosahexaenoic acid (DHA)-derived respec- tive LM biosynthetic pathways and their selected values between HS and MS. (C) Schematic representation of the eicosapentaenoic acid (EPA)-derived respective LM biosynthetic pathways and their selected values between HS and MS. Data are presented as means pg/mL±standard error of mean. *P<0.05 or **P<0.01 com- pared to HS, determined by Student t-test.
abundance for each gene in respect with beta actin or GAPDH expression.
Electric cell-substrate impedance sensing
hCMEC/D3 cells were seeded on collagen-coated 96W10idf electric cell-substrate impedance sensing (ECIS) arrays (Ibidi). Trans-endothelial electrical resistance (TEER) of hCMEC/D3 cells was measured at multiple frequencies,21 and TNF-a was added as maximum barrier resistance was reached, in the presence or absence of different SPM. Subsequently, TEER was measured over time and finally analyzed.22
ELISA
hCMEC/D3 culture supernatants harvested 24 hours after TNF-a treatment in the presence or absence of SPM were meas-
ured for the levels of CCL2/MCP-1 by its commercial ELISA Kit (Invitrogen, the Netherlands) according to the manufacturer’s instructions.
Transwell migration of monocytes
In vitro monocyte transendothelial cell migration assay was per- formed using a collagen 1-coated Transwell system. Briefly, hCMEC/D3 cells were cultured alone or with TNF-a upon which resting or SPM-treated purified human monocytes were added to the transwell filters.23,24 Transmigrated cells were determined through flow cytometry.
Statistical analysis
All data were expressed as means±standard error of mean (SEM). Differences between groups were compared using Student
2060
haematologica | 2020; 105(8)
