
Page 102 - 2020_08-Haematologica-web
P. 102
S. Wang et al.
7A). The effect of hemin on the colony-forming capacity was concentration-dependent, and 50 mM hemin was suf- ficient to rescue the colony-forming capacity of cKO cells to control levels (Figure 7B). In contrast, 0.25 mM Fe/8-HQ failed to rescue CFU-GEMM forming capacity of cKO
A
cells, while Fe/8-HQ at a higher dose of 0.5 mM was toxic (data not shown). These results suggest that heme may serve as an alternative iron source other than Tf-iron in order to meet the cellular iron demand in FL HSPC in the absence of Tfr1.
B
CDEFG
HIJKL
MNOP
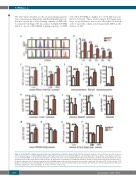
Figure 5. Postnatal Tfr1 conditional knockout mice have dysregulated cellular iron homeostasis. (A) Flow cytometric analysis of calcein fluorescence was measured in the indicated stages of erythroid differentiation. (B) Relative mean fluorescence intensity (MFI) of calcein in figure 5A (n=4 per group). (C-D) Relative mean fluo- rescence intensity (MFI) of calcein measured in mature hematopoietic (Lin+) cells (C) and LSK and hematopoietic progenitor cells (HPC) cells (D) obtained from control and Tfr1 knockout (cKO) bone marrow (n=4 per group). (E) Serum iron concentration, (F) transferrin saturation, and (G) serum hepcidin. (H-I) Liver non-heme iron, (J- K) spleen non-heme iron, (L) muscle non-heme iron, and (M-N) whole body non-heme iron were measured in control and cKO pups at P3 (n=5 per group). (O-P) Relative mean fluorescence intensity (MFI) of calcein measured in Lin+ cells (O), LSK (Lin-cKit+Sca1hi) and HPC (Lin–cKit+Sca1–) cells (P) obtained from control and cKO livers at E16.5 (n = 4 for each group). *P<0.05; **P<0.01; ***P<0.001.
2078
haematologica | 2020; 105(8)
